Quantcast
Channel: sFlow
Viewing all 348 articles
Browse latest View live

Integrated hybrid OpenFlow control of HP switches

$
0
0
Performance optimizing hybrid OpenFlow controller describes InMon's sFlow-RT controller. The controller makes use of the sFlow and OpenFlow standards and is optimized for real-time traffic engineering applications that managing large traffic flows, including: DDoS mitigation, ECMP load balancing, LAG load balancing, large flow marking etc.

The previous article provided an example of large flow marking using an Alcatel-Lucent OmniSwitch 6900 switch. This article discusses how to replicate the example using HP Networking switches.

At present, the following HP switch models are listed as having OpenFlow support:
  • FlexFabric 12900 Switch Series
  • 12500 Switch Series
  • FlexFabric 11900 Switch Series
  • 8200 zl Switch Series
  • HP FlexFabric 5930 Switch Series
  • 5920 Switch Series
  • 5900 Switch Series
  • 5400 zl Switch Series
  • 3800 Switch Series
  • HP 3500 and 3500 yl Switch Series
  • 2920 Switch Series 
Note: All of the above HP switches (and many others) support the sFlow standard - see sFlow Products: Network Equipment @ sFlow.org.

HP's OpenFlow implementation supports integrated hybrid mode - provided the OpenFlow controller pushes a default low priority OpenFlow rule that matches all packets and applies the NORMAL action (i.e. instructs the switch to apply default switching / routing forwarding to the packets).

In this example, an HP 5400 zl switch is used to run a slightly modified version of the sFlow-RT controller JavaScript application described in Performance optimizing hybrid OpenFlow controller:
// Define large flow as greater than 100Mbits/sec for 0.2 seconds or longer
var bytes_per_second = 100000000/8;
var duration_seconds = 0.2;

var idx = 0;

setFlow('tcp',
{keys:'ipsource,ipdestination,tcpsourceport,tcpdestinationport',
value:'bytes', filter:'direction=ingress', t:duration_seconds}
);

setThreshold('elephant',
{metric:'tcp', value:bytes_per_second, byFlow:true, timeout:2,
filter:{ifspeed:[1000000000]}}
);

setEventHandler(function(evt) {
var agent = evt.agent;
var ports = ofInterfaceToPort(agent);
if(ports && ports.length == 1) {
var dpid = ports[0].dpid;
var id = "mark" + idx++;
var k = evt.flowKey.split(',');
var rule= {
priority:500, idleTimeout:20,
match:{dl_type:2048, nw_proto:6, nw_src:k[0], nw_dst:k[1],
tp_src:k[2], tp_dst:k[3]},
actions:["set_nw_tos=128","output=normal"]
};
setOfRule(dpid,id,rule);
}
},['elephant']);
The idleTimeout was increased from 2 to 20 seconds since the switch has a default Probe Interval of 10 seconds (the interval between OpenFlow counter updates). If the OpenFlow rule idleTimeout is set shorter than the Probe Interval the switch will remove the OpenFlow rule before the flow ends.
Mar. 27, 2014 Update: The  HP Switch Software OpenFlow Administrator's Guide K/KA/WB 15.14, Appendix B Implementation Notes, describes the effect of the probe interval on idle timeouts and describes how to change the default (using openflow hardware statistics refresh rate) but warns that shorter refresh rates will increase CPU load on the switch.
The following command line arguments load the script and enable OpenFlow on startup:
-Dscript.file=ofmark.js \
-Dopenflow.controller.start=yes \
-Dopenflow.controller.addNormal=yes
The additional highlighted argument instructs the sFlow-RT controller to install the wild card OpenFlow NORMAL rule automatically when the switch connects.

The screen capture at the top of the page shows a mixture of small flows "mice" and large flows "elephants" generated by a server connected to the HP 5406 zl switch. The graph at the bottom right shows the mixture of unmarked traffic being sent to the switch. The sFlow-RT controller receives a stream of sFlow measurements from the switch and detects each elephant flows in real-time, immediately installing an OpenFlow rule that matches the flow and instructing the switch to mark the flow by setting the IP type of service bits. The traffic upstream of the switch is shown in the top right chart and it can be clearly seen that each elephant flow has been identified and marked, while the mice have been left unmarked.
Note: While this demonstration only used a single switch, the solution easily scales to hundreds of switches and thousands of edge ports.
The results from the HP switch are identical to those obtained with the Alcatel-Lucent switch, demonstrating the multi-vendor interoperability provided by the sFlow and OpenFlow standards. In addition, sFlow-RT's support for an open, standards based, programming environment (JavaScript / ECMAScript) makes it an ideal platform for rapidly developing and deploying traffic engineering SDN applications in existing networks.

Cisco, ACI, OpFlex and OpenDaylight

$
0
0
Cisco's April 2nd, 2014 announcement - Cisco and Industry Leaders Will Deliver Open, Multi-Vendor, Standards-Based Networks for Application Centric Infrastructure with OpFlex Protocol - has drawn mixed reviews from industry commentators.

In, Cisco Submits Its (Very Different) SDN to IETF & OpenDaylight, SDNCentral editor Craig Matsumoto comments, "You know how, early on, people were all worried Cisco would 'take over' OpenDaylight? This is pretty much what they were talking about. It’s not a 'takeover,' literally, but OpFlex and the group policy concept steer OpenDaylight into a new direction that it otherwise wouldn’t have, one that Cisco happens to already have taken."

CIMI Corp. President, Tom Nolle, remarks "We’re all in business to make money, and if Cisco takes a position in a key market like SDN that seems to favor…well…doing nothing much different, you have to assume they have good reason to believe that their approach will resonate with buyers." - Cisco’s OpFlex: We Have Sound AND Fury

This article will look at some of the architectural issues raised by Cisco's announcement based on the following documents:
The diagram at the top of this article illustrates the architecture of Cisco's OpenDaylight proposal.  The crack in the diagram was added to show the split between Cisco's proposed additions and existing OpenDaylight components. It is clear that Cisco has simply bolted a new controller to the side of the existing OpenDaylight controller, the ACI controller on the left has a native Southbound API (OpFlex) and treats the the existing OpenDaylight controller as a Southbound plug-in (the arrow that connects the Affinity Decomposer module to the existing Affinity Service module). The existing OpenDaylight controller is marginalized by relegating its role to managing Traditional Network Elements, implying that next generation SDN revolves around devices that support the OpFlex protocol exclusively.

What is the function of Cisco's new controller? The press release states, ACI is the first data center and cloud solution to offer full visibility and integrated management of both physical and virtual networked IT resources, accelerating application deployment through a dynamic, application-aware network policy model. However, if you look a little deeper - Cisco Application Policy Infrastructure Controller Data Center Policy Model - the underlying architecture of ACI is based on promise theory.

Promise theory underpins many data center orchestration tools, including: CFEngine, Puppet, Chef, Ansible, and Salt. These automation tools are an important part of the DevOps toolkit - providing a way to rapidly reconfigure resources and roll out new services. Does it make sense to create a new controller and protocol just to manage network equipment?
The DevOps movement has revolutionized the data center by breaking down silos, merging application development and IT operations to increase the speed and agility of service creation and delivery.
An alternative to creating a new, network only, orchestration system is to open up network equipment to the orchestration tools that DevOps teams already use. The article, Dell, Cumulus, Open Source, Open Standards, and Unified Management, discusses the trend toward open, Linux-based, switch platforms. An important benefit of this move to open networking platforms is that the same tools that are today used to manage Linux servers can also be used to manage the configuration of the network - for example, Cumulus Architecture currently lists Puppet, Chef and CFEngine as options for network automation. Eliminating the need to deploy and coordinate separate network and system orchestration tools significantly reduces operational complexity and increases agility; breaking down the network silo to facilitate the creation of a NetDevOps team.
While it might be argued that Cisco's ACI/OpFlex is better at configuring network devices than existing DevOps tools, the fierce competition and rapid pace of innovation in the DevOps space is likely to outpace Cisco's efforts to standardize the OpFlex protocol in the IETF.
Finally, it is not clear how serious Cisco is about its ACI architecture. Cisco Nexus 3000 series switches are based on standard merchant silicon hardware and support open, multi-vendor, standards and APIs, including: sFlow, OpenFlow, Linux Containers, XML, JSON, Puppet, Chef, Python, and OpenStack. Nexus 9000 series switches, the focus of Cisco's ACI strategy, include custom Cisco hardware to support ACI but also contain merchant silicon, allowing the switches to be run in either ACI or NX-OS mode. The value of open platforms is compelling and I expect Cisco's customers will favor NX-OS mode on the Nexus 9000 series and push Cisco to provide feature parity with the Nexus 3000 series.

DDoS mitigation hybrid OpenFlow controller

$
0
0
Performance optimizing hybrid OpenFlow controller describes the growing split in the SDN controller market between edge controllers using virtual switches to deliver network virtualization (e.g. VMware NSX, Nuage Networks, Juniper Contrail, etc.) and fabric controllers that optimize performance of the physical network. The article provides an example using InMon's sFlow-RT controller to detect and mark large "elephant" flows so that they don't interfere with latency sensitive small "mice" flows.

This article describes an additional example, using the sFlow-RT controller to implement the ONS 2014 SDN Idol winning distributed denial of service (DDoS) mitigation solution - Real-time SDN Analytics for DDoS mitigation.
Figure 1:ISP/IX Market Segment
Figure 1 shows how service providers are ideally positioned to mitigate large flood attacks directed at their customers. The mitigation solution involves an SDN controller that rapidly detects and filters out attack traffic and protects the customer's Internet access.
Figure 2: Novel DDoS Mitigation solution using Real-time SDN Analytics
Figure 2 shows the elements of the control system in the SDN Idol demonstration. The addition of an embedded OpenFlow controller in sFlow-RT allows the entire DDoS mitigation system to be collapsed into the following sFlow-RT JavaScript application:
// Define large flow as greater than 100Mbits/sec for 1 second or longer
var bytes_per_second = 100000000/8;
var duration_seconds = 1;

var idx = 0;

setFlow('udp_target',
{keys:'ipdestination,udpsourceport',
value:'bytes', filter:'direction=egress', t:duration_seconds}
);

setThreshold('attack',
{metric:'udp_target', value:bytes_per_second, byFlow:true, timeout:2,
filter:{ifspeed:[1000000000]}}
);

setEventHandler(function(evt) {
var agent = evt.agent;
var ports = ofInterfaceToPort(agent);
if(ports && ports.length == 1) {
var dpid = ports[0].dpid;
var id = "drop" + idx++;
var k = evt.flowKey.split(',');
var rule= {
priority:500, idleTimeout:20, hardTimeout:3600,
match:{dl_type:2048, nw_proto:17, nw_dst:k[0], tp_src:k[1]},
actions:[]
};
setOfRule(dpid,id,rule);
}
},['attack']);
The following command line arguments load the script and enable OpenFlow on startup:
-Dscript.file=ddos.js -Dopenflow.controller.start=yes
Some notes on the script:
  1. The 100Mbits/s threshold for large flows was selected because it represents 10% of the bandwidth of the 1Gigabit access ports on the network
  2. The setFlow filter specifies egress flows since the goal is to filter flows as converge on customer facing egress ports.
  3. The setThreshold filter specifies that thresholds are only applied to 1Gigabit access ports
  4. The OpenFlow rule generated in setEventHandler matches the destination address and source port associated with the DDoS attack and includes an idleTimeout of 20 seconds and a hardTimeout of 3600 seconds. This means that OpenFlow rules are automatically removed by the switch when the flow becomes idle without any further intervention from the controller. If the attack is still in progress when the hardTimeout expires and the rule is removed, the attack will be immediately be detected by the controller and a new rule will be installed.
The nping tool can be used to simulate DDoS attacks to test the application. The following script simulates a series of DNS reflection attacks:
while true; do nping --udp --source-port 53 --data-length 1400 --rate 2000 --count 700000 --no-capture --quiet 10.100.10.151; sleep 40; done
The following screen capture shows a basic test setup and results:
The chart at the top right of the screen capture shows attack traffic mixed with normal traffic arriving at the edge switch. The switch sends a continuous stream of measurements to the sFlow-RT controller running the DDoS mitigation application. When an attack is detected, an OpenFlow rule is pushed to the switch to block the traffic. The chart at the bottom right trends traffic on the protected customer link, showing that normal traffic is left untouched, but attack traffic is immediately detected and removed from the link.
Note: While this demonstration only used a single switch, the solution easily scales to hundreds of switches and thousands of edge ports.
This example, along with the large flow marking example, demonstrates that basing the sFlow-RT fabric controller on widely supported sFlow and OpenFlow standards and including an open, standards based, programming environment (JavaScript / ECMAScript) makes sFlow-RT an ideal platform for rapidly developing and deploying traffic engineering SDN applications in existing networks.

Configuring Mellanox switches

$
0
0
The following commands configure a Mellanox switch (10.0.0.252) to sample packets at 1-in-10000, poll counters every 30 seconds and send sFlow to an analyzer (10.0.0.50) using the default sFlow port 6343:
sflow enable
sflow agent-ip 10.0.0.252
sflow collector-ip 10.0.0.50
sflow sampling-rate 10000
sflow counter-poll-interval 30
For each interface:
interface ethernet 1/1 sflow enable
A previous posting discussed the selection of sampling rates. Additional information can be found on the Mellanox web site.

See Trying out sFlow for suggestions on getting started with sFlow monitoring and reporting.

Mininet integrated hybrid OpenFlow testbed

$
0
0
Figure 1: Hybrid Programmable Forwarding Planes
Integrated hybrid OpenFlow combines OpenFlow and existing distributed routing protocols to deliver robust software defined networking (SDN) solutions. Performance optimizing hybrid OpenFlow controller describes how the sFlow and OpenFlow standards combine to deliver visibility and control to address challenges including: DDoS mitigation, ECMP load balancing, LAG load balancing, and large flow marking.

A number of vendors support sFlow and integrated hybrid OpenFlow today, examples described on this blog include: Alcatel-Lucent, Brocade, and Hewlett-Packard. However, building a physical testbed is expensive and time consuming. This article describes how to build an sFlow and hybrid OpenFlow testbed using free Mininet network emulation software. The testbed emulates ECMP leaf and spine data center fabrics and provides a platform for experimenting with analytics driven feedback control using the sFlow-RT hybrid OpenFlow controller.

First build an Ubuntu 13.04 / 13.10 virtual machine then follow instructions for installing Mininet - Option 3: Installation from Packages.

Next, install an Apache web server:
sudo apt-get install apache2
Install the sFlow-RT integrated hybrid OpenFlow controller, either on the Mininet virtual machine, or on a different system (Java 1.6+ is required to run sFlow-RT):
wget http://www.inmon.com/products/sFlow-RT/sflow-rt.tar.gz
tar -xvzf sflow-rt.tar.gz
Copy the leafandspine.py script from the sflow-rt/extras directory to the Mininet virtual machine.

The following options are available:
./leafandspine.py --help
Usage: leafandspine.py [options]

Options:
-h, --help show this help message and exit
--spine=SPINE number of spine switches, default=2
--leaf=LEAF number of leaf switches, default=2
--fanout=FANOUT number of hosts per leaf switch, default=2
--collector=COLLECTOR
IP address of sFlow collector, default=127.0.0.1
--controller=CONTROLLER
IP address of controller, default=127.0.0.1
--topofile=TOPOFILE file used to write out topology, default topology.txt
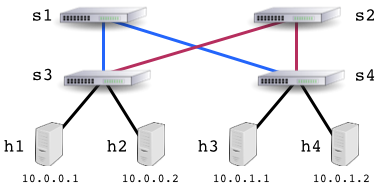
Figure 2 shows a simple leaf and spine topology consisting of four hosts and four switches:
Figure 2: Simple leaf and spine topology
The following command builds the topology and specifies a remote host (10.0.0.162) running sFlow-RT as the hybrid OpenFlow controller and sFlow collector:
sudo ./leafandspine.py --collector 10.0.0.162 --controller 10.0.0.162 --topofile /var/www/topology.json
Note: All the links are configured to 10Mbit/s and the sFlow sampling rate is set to 1-in-10. These settings are equivalent to a 10Gbit/s network with a 1-in-10,000 sampling rate - see Large flow detection.

The network topology is written to  /var/www/topology.json making it accessible through HTTP. For example, the following command retrieves the topology from the Mininet VM (10.0.0.61):
curl http://10.0.0.61/topology.json
{"nodes": {"s3": {"ports": {"s3-eth4": {"ifindex": "392", "name": "s3-eth4"}, "s3-eth3": {"ifindex": "390", "name": "s3-eth3"}, "s3-eth2": {"ifindex": "402", "name": "s3-eth2"}, "s3-eth1": {"ifindex": "398", "name": "s3-eth1"}}, "tag": "edge", "name": "s3", "agent": "10.0.0.61", "dpid": "0000000000000003"}, "s2": {"ports": {"s2-eth1": {"ifindex": "403", "name": "s2-eth1"}, "s2-eth2": {"ifindex": "405", "name": "s2-eth2"}}, "name": "s2", "agent": "10.0.0.61", "dpid": "0000000000000002"}, "s1": {"ports": {"s1-eth1": {"ifindex": "399", "name": "s1-eth1"}, "s1-eth2": {"ifindex": "401", "name": "s1-eth2"}}, "name": "s1", "agent": "10.0.0.61", "dpid": "0000000000000001"}, "s4": {"ports": {"s4-eth2": {"ifindex": "404", "name": "s4-eth2"}, "s4-eth3": {"ifindex": "394", "name": "s4-eth3"}, "s4-eth1": {"ifindex": "400", "name": "s4-eth1"}, "s4-eth4": {"ifindex": "396", "name": "s4-eth4"}}, "tag": "edge", "name": "s4", "agent": "10.0.0.61", "dpid": "0000000000000004"}}, "links": {"s2-eth1": {"ifindex1": "403", "ifindex2": "402", "node1": "s2", "node2": "s3", "port2": "s3-eth2", "port1": "s2-eth1"}, "s2-eth2": {"ifindex1": "405", "ifindex2": "404", "node1": "s2", "node2": "s4", "port2": "s4-eth2", "port1": "s2-eth2"}, "s1-eth1": {"ifindex1": "399", "ifindex2": "398", "node1": "s1", "node2": "s3", "port2": "s3-eth1", "port1": "s1-eth1"}, "s1-eth2": {"ifindex1": "401", "ifindex2": "400", "node1": "s1", "node2": "s4", "port2": "s4-eth1", "port1": "s1-eth2"}}}
Don't start sFlow-RT yet, it should only be started after Mininet has finished building the topology.

Verify connectivity before starting sFlow-RT:
mininet> pingall
*** Ping: testing ping reachability
h1 -> h2 h3 h4
h2 -> h1 h3 h4
h3 -> h1 h2 h4
h4 -> h1 h2 h3
*** Results: 0% dropped (12/12 received)
This test demonstrates that the Mininet topology has been constructed with a set of default forwarding rules that provide connectivity without the need for an OpenFlow controller - emulating the behavior of  a network of integrated hybrid OpenFlow switches.

The following sFlow-RT script ecmp.js demonstrates ECMP load balancing in the emulated network:
include('extras/json2.js');

// Define large flow as greater than 1Mbits/sec for 1 second or longer
var bytes_per_second = 1000000/8;
var duration_seconds = 1;

var top = JSON.parse(http("http://10.0.0.61/topology.json"));
setTopology(top);

setFlow('tcp',
{keys:'ipsource,ipdestination,tcpsourceport,tcpdestinationport',
value:'bytes', t:duration_seconds}
);

setThreshold('elephant',
{metric:'tcp', value:bytes_per_second, byFlow:true, timeout:2}
);

setEventHandler(function(evt) {
var rec = topologyInterfaceToLink(evt.agent,evt.dataSource);
if(!rec || !rec.link) return;
var link = topologyLink(rec.link);
logInfo(link.node1 + "-" + link.node2 + "" + evt.flowKey);
},['elephant']);
Modify the sFlow-RT start.sh script to include the following arguments:
RT_OPTS="-Dopenflow.controller.start=yes -Dopenflow.controller.flushRules=no"
SCRIPTS="-Dscript.file=ecmp.js"
Some notes on the script:
  1. The topology is retrieved by making an HTTP request to the Mininet VM (10.0.0.61)
  2. The 1Mbits/s threshold for large flows was selected because it represents 10% of the bandwidth of the 10Mbits/s links in the emulated network
  3. The event handler prints the link the flow traversed - identifying the link by the pair of switches it connects
Start sFlow-RT:
./start.sh
Now generate some large flows between h1 and h3 using the Mininet iperf command:
mininet> iperf h1 h3
*** Iperf: testing TCP bandwidth between h1 and h3
*** Results: ['9.58 Mbits/sec', '10.8 Mbits/sec']
mininet> iperf h1 h3
*** Iperf: testing TCP bandwidth between h1 and h3
*** Results: ['9.58 Mbits/sec', '10.8 Mbits/sec']
mininet> iperf h1 h3
*** Iperf: testing TCP bandwidth between h1 and h3
*** Results: ['9.59 Mbits/sec', '10.3 Mbits/sec']
The following results were logged by sFlow-RT:
2014-04-21T19:00:36-0700 INFO: ecmp.js started
2014-04-21T19:01:16-0700 INFO: s1-s3 10.0.0.1,10.0.1.1,49240,5001
2014-04-21T19:01:16-0700 INFO: s1-s4 10.0.0.1,10.0.1.1,49240,5001

2014-04-21T20:53:19-0700 INFO: s2-s4 10.0.0.1,10.0.1.1,49242,5001
2014-04-21T20:53:19-0700 INFO: s2-s3 10.0.0.1,10.0.1.1,49242,5001

2014-04-21T20:53:29-0700 INFO: s1-s3 10.0.0.1,10.0.1.1,49244,5001
2014-04-21T20:53:29-0700 INFO: s1-s4 10.0.0.1,10.0.1.1,49244,5001
The results demonstrate that the emulated leaf and spine network is performing equal cost multi-path (ECMP) forwarding - different flows between the same pair of hosts take different paths across the fabric (the highlighted lines correspond to the paths shown in Figure 2).
Open vSwitch in Mininet is the key to this emulation, providing sFlow and multi-path forwarding support 
The following script implements the large flow marking example described in Performance optimizing hybrid OpenFlow controller:
include('extras/json2.js');

// Define large flow as greater than 1Mbits/sec for 1 second or longer
var bytes_per_second = 1000000/8;
var duration_seconds = 1;

var idx = 0;

var top = JSON.parse(http("http://10.0.0.61/topology.json"));
setTopology(top);

setFlow('tcp',
{keys:'ipsource,ipdestination,tcpsourceport,tcpdestinationport',
value:'bytes', t:duration_seconds}
);

setThreshold('elephant',
{metric:'tcp', value:bytes_per_second, byFlow:true, timeout:4}
);

setEventHandler(function(evt) {
var agent = evt.agent;
var ds = evt.dataSource;
if(topologyInterfaceToLink(agent,ds)) return;

var ports = ofInterfaceToPort(agent,ds);
if(ports && ports.length == 1) {
var dpid = ports[0].dpid;
var id = "mark" + idx++;
var k = evt.flowKey.split(',');
var rule= {
priority:1000, idleTimeout:2,
match:{dl_type:2048, nw_proto:6, nw_src:k[0], nw_dst:k[1],
tp_src:k[2], tp_dst:k[3]},
actions:["set_nw_tos=128","output=normal"]
};
setOfRule(dpid,id,rule);
}
},['elephant']);

setFlow('tos0',{value:'bytes',filter:'iptos=00000000',t:1});
setFlow('tos128',{value:'bytes',filter:'iptos=10000000',t:1});
Some notes on the script:
  1. The topologyInterfaceToLink() function looks up link information based on agent and interface. The event handler uses this function to exclude inter-switch links, applying controls to ingress ports only.
  2. The OpenFlow rule priority for rules created by controller scripts must be greater than 500 to override the default rules created by leafandspine.py
  3. The tos0 and tos128 flow definitions have been added to so that the re-marking can be seen.
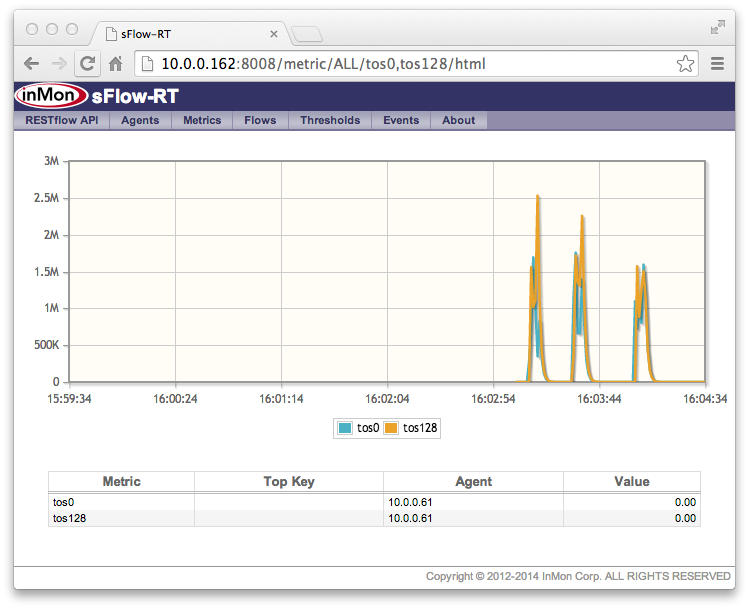
Restart sFlow-RT with the new script and use a web browser to view the default tos0 and the re-marked tos128 traffic.
Figure 3: Marking large flows
Use iperf to generate traffic between h1 and h3 (the traffic needs to cross more than one switch so it can be observed before and after marking). The screen capture in figure 3 demonstrates that the controller immediately detects and marks large flows.

Load balancing large flows on multi-path networks

$
0
0
Figure 1: Active control of large flows in a multi-path topology
Figure 1 shows initial results from the Mininet integrated hybrid OpenFlow testbed demonstrating that active steering of large flows using a performance aware SDN controller significantly improves network throughput of multi-path network topologies.
Figure 2: Two path topology
The graph in Figure 1 summarizes results from topologies with 2, 3 and 4 equal cost paths. For example, the Mininet topology in Figure 2 has two equal cost paths of 10Mbit/s (shown in blue and red). The iperf traffic generator was used to create a continuous stream of 20 second flows from h1 to h3 and from h2 to h4. If traffic were perfectly balanced, each flow would achieve 10Mbit/s throughput. However, Figure 1 shows that the throughput obtained using hash based ECMP load balancing is approximately 6.8Mbit/s. Interestingly, the average link throughput decreases as additional paths are added, dropping to approximately 6.2Mbit/s with four equal cost paths (see the blue bars in Figure 1).

To ensure that packets in a flow arrive in order at their destination, switch s3 computes a hash function over selected fields in the packets (e.g. source and destination IP addresses + source and destination TCP ports) and picks a link based on the value of the hash, e.g.
index = hash(packet fields) % linkgroup.size
selected_link = linkgroup[index]
The drop in throughput occurs when two or more large flows are assigned to the same link by the hash function and must compete for bandwidth.
Figure 3:Performance optimizing hybrid OpenFlow controller
Performance optimizing hybrid OpenFlow controller describes how the sFlow and OpenFlow standards can be combined to provide analytics driven feedback control to automatically adapt resources to changing demand. In this example, the controller has been programmed to detect large flows arriving on busy links and steer them to a less congested alternative path. The results shown in Figure 1 demonstrate that actively steering the large flows increases average link throughput by between 17% and 20% (see the red bars).
There results were obtained using a very simple initial control scheme and there is plenty of scope for further improvement since a 50-60% increase in throughput over hash based ECMP load balancing is theoretically possible based on the results from these experiments.
This solution easily scales to 10G data center fabrics. Support for the sFlow standard is included in most vendor's switches (Alcatel-Lucent, Arista, Brocade, Cisco, Dell, Extreme, HP, Huawei, IBM, Juniper, Mellanox, ZTE, etc.) providing data center wide visibility - see Drivers for growth. Combined with increasing maturity and vendor support for the OpenFlow standard provides the real-time control of packet forwarding needed to adapt the network to changing traffic. Finally, flow steering is one of a number of techniques that combine to amplify performance gains delivered by the controller, other techniques include: large flow marking, DDoS mitigation, and workload placement.

SDN fabric controller for commodity data center switches

$
0
0
Figure 1: Rise of merchant silicon
Figure 1 illustrates the rapid transition to merchant silicon among leading data center network vendors, including: Alcatel-Lucent, Arista, Cisco, Cumulus, Dell, Extreme, Juniper, Hewlett-Packard, and IBM.

This article will examine some of the factors leading to commoditization of network hardware and the role that software defined networking (SDN) plays in coordinating hardware resources to deliver increased network efficiency.
Figure 2: Fabric: A Retrospective on Evolving SDN
The article, Fabric: A Retrospective on Evolving SDN by Martin Casado, Teemu Koponen, Scott Shenker, and Amin Tootoonchian, makes the case for a two tier SDN architecture; comprising a smart edge and an efficient core.
Table 1: Edge vs Fabric Functionality
Virtualization and advances in the networking capability of x86 based servers are drivers behind this separation. Virtual machines are connected to each other and to the physical network using a software virtual switch. The software switch provides the flexibility to quickly develop and deploy advanced features like network virtualization, tenant isolation, distributed firewalls, etc. Network function virtualization (NFV) is moving firewall, load balancing, routing, etc. functions from dedicated appliances to virtual machines or embedding them within the virtual switches. The increased importance of network centric software has driven dramatic improvements in the performance of commodity x86 based servers, reducing the need for complex hardware functions in network devices.

As complex functions shift to software running on servers at the network edge, the role of the core physical network is simplified. Merchant silicon provides a cost effective way of delivering the high performance forwarding capabilities needed to interconnect servers and Figure 1 shows how Broadcom based switches are now dominating the market.

The Broadcom white paper, Engineered Elephant Flows for Boosting Application Performance in Large-Scale CLOS Networks, describes the challenge of posed by large "Elephant" flows and describes the opportunity to use software defined networking to orchestrate hardware resources and improve network efficiency.
Figure 3: Feedback controller
Figure 3 shows the elements of an SDN feedback controller. Network measurements are analyzed to identify network hot spots, available resources, and large flows. The controller then plans a response and deploys controls in order to allocate resources where they are needed and reduce contention. The control system operates as a continuous loop. The effect of the changes are observed by the measurement system and further changes are made as needed.

Implementing the controller requires an understanding of the measurement and control capabilities of the Broadcom ASICs.

Control Protocol

Figure 4: Programming Pipeline for ECMP
The Broadcom white paper focuses on the ASIC architecture and control mechanisms and includes the functional diagram shown in Figure 4. The paper describes two distinct configuration tasks:
  1. Programming the Routing Flow Table and ECMP Select Groups to perform equal cost multi-path forwarding of the majority of flows.
  2. Programming the ACL Policy Flow Table to selectively override forwarding decisions for relatively small number of Elephant flows responsible for the bulk of the traffic on the network.
Managing the Routing and ECMP Group tables is well understood and there are a variety of solutions available that can be used to configure ECMP forwarding:
  1. CLI— Use switch CLI to configure distributed routing agents running on each switch (e.g. OSPF, BGP, etc.)
  2. Configuration Protocol— Similar to 1, but programmatic configuration protocols such as NETCONF or JSON RPC replaces CLI.
  3. Server orchestration— Open Linux based switch platforms allow server management agents to be installed on the switches to manage configuration. For example, Cumulus Linux supports Puppet, Chef, CFEngine, etc.
  4. OpenFlow— The white paper describes using the Ryu controller to calculate routes and update the forwarding and group tables using OpenFlow 1.3+ to communicate with Indigo OpenFlow agents on the switches.  
The end result is very similar whatever method is chosen to populate the Routing and and ECMP Group tables - the hardware forwards packets across multiple paths based on a hash function calculated over selected fields in the packets (e.g. source and destination IP addresses + source and destination TCP ports), e.g.
index = hash(packet fields) % group.size
selected_physical_port = group[index]
Hash based load balancing works well for the large numbers of small flows "Mice" on the network, but is less suitable for the long lived large "Elephant" flows. The hash function may assign multiple Elephant flows to the same physical port (even if other ports in the group are idle), resulting in congestion and poor network performance.
Figure 5: Long vs Short flows (from The Nature of Datacenter Traffic: Measurements & Analysis)
The traffic engineering controller uses ACL Flow Policy table to manage Elephant flows, ensuring that they don't interfere with latency sensitive Mice and are evenly distributed across the available paths - see Marking large flows and ECMP load balancing.
Figure 6: Hybrid Programmable Forwarding Plane, David Ward, ONF Summit, 2011
Integrated hybrid OpenFlow 1.0 is an effective mechanism for exposing the ACL Policy Flow Table to an external controller:
  • Simple, no change to normal forwarding behavior, can be combined with any of the mechanisms used to manage the Routing and ECMP Group tables listed above.
  • Efficient, Routing and ECMP Group tables efficiently handle most flows. OpenFlow used to control ACL Policy Flow Table and selectively override forwarding of specific flows (block, mark, steer, rate-limit), maximizing effectiveness of limited number of entries available.
  • Scaleable, most flows handled by existing control plane, OpenFlow only used when controller wants to make an exception.
  • Robust, if controller fails network keeps forwarding
The control protocol is only half the story. An effective measurement protocol is needed to rapidly identify network hot spots, available resources, and large flows so that the controller can identify the which flows need to be managed and where to apply the controls.

Measurement Protocol

The Broadcom white paper is limited in its discussion of measurement, but it does list four ways of detecting large flows:
  1. A priori
  2. Monitor end host socket buffers
  3. Maintain per flow statistics in network
  4. sFlow
The first two methods involve signaling the arrival of large flows to the network from the hosts. Both methods have practical difficulties in that they require that every application and / or host implement the measurements and communicate them to the fabric controller - a difficult challenge in a heterogeneous environment. However, the more fundamental problem is that while both methods can usefully identify the arrival of large flows, they don't provide sufficient information for the fabric controller to take action since it also needs to know the load on all the links in the fabric.

The requirement for end to end visibility can only be met if the instrumentation is built into the network devices, which leads to options 3 and 4. Option 3 would require an entry in the ACL table for each flow and the Broadcom paper points out that this approach does not scale.

The solution to the measurement challenge is option 4. Support for the multi-vendor sFlow protocol is included in Broadcom ASIC, is completely independent of the forwarding tables, and can be enabled on all port and all switches to provide the end to end visibility needed for effective control.
Figure 7: Custom vs. merchant silicon traffic measurement
Figure 7 compares traffic measurement on legacy custom ASIC based switches with standard sFlow measurements supported by merchant silicon vendors. The custom ASIC based switch, shown on top, performs many of the traffic flow analysis functions in hardware. In contrast, merchant silicon based switches shift flow analysis to external software, implementing only the essential measurement functions required for wire speed performance in silicon.

Figure 7 lists a number of benefits that result from moving flow analysis from the custom ASIC to external software, but in the context of large flow traffic engineering the real-time detection of flows made possible by an external flow cache is the essential if the traffic engineering controller is to be effective - see Rapidly detecting large flows, sFlow vs. NetFlow/IPFIX
Figure 8: sFlow-RT feedback controller
Figure 8 shows a fully instantiated SDN feedback controller. The sFlow-RT controller leverages the sFlow and OpenFlow standards to optimize the performance of fabrics built using commodity switches. The following practical applications for the sFlow-RT controllers have already been demonstrated:
While the industry at large appears to be moving to the Edge / Fabric architecture shown in Figure 2, Cisco's Application Centric Infrastructure (ACI) is an anomaly. ACI is a tightly integrated proprietary solution; the Cisco Application Policy Infrastructure Controller (APIC) uses the Cisco OpFlex protocol to manage Cisco Nexus 9000 switches and Cisco AVI virtual switches. For example, the Cisco Nexus 9000 switches are based on Broadcom silicon and provide an interoperable NX-OS mode. However, line cards that include an Application Leaf Engines (ALE) ASIC along with the Broadcom ASIC are required to support ACI mode. The ALE provides visibility and control features for large flow load balancing and prioritization - both of which can be achieved using standard protocols to manage the capabilities of the Broadcom ASIC.

It will be interesting to see whether ACI is able to compete with modular, low cost, solutions based on open standards and commodity hardware. Cisco has offered its customers a choice and given the compelling value of open platforms I expect many will choose not to be locked into the proprietary ACI solution and will favor NX-OS mode on the Nexus 9000 series, pushing Cisco to provide the full set of open APIs currently available on the Nexus 3000 series (sFlow, OpenFlow, Puppet, Python etc.).
Figure 9: Move communicating virtual machines together to reduce network traffic (from NUMA)
Finally, SDN is only one piece of a larger effort to orchestrate network, compute and storage resources to create a software defined data center (SDDC). For example, Figure 9 shows how network analytics from the fabric controller can be used move virtual machines (e.g. by integrating with OpenStack APIs) to reduce application response times and network traffic. More broadly, feedback control allows efficient matching of resources to workloads and can dramatically increase the efficiency of the data center - see Workload placement.

Cumulus Networks, sFlow and data center automation

$
0
0
Cumulus Networks and InMon Corp have ported the open source Host sFlow agent to the upcoming Cumulus Linux 2.1 release. The Host sFlow agent already supports Linux, Windows, FreeBSD, Solaris, and AIX operating systems and KVM, Xen, XCP, XenServer, and Hyper-V hypervisors, delivering a standard set of performance metrics from switches, servers, hypervisors, virtual switches, and virtual machines - see Visibility and the software defined data center

The Cumulus Linux platform makes it possible to run the same open source agent on switches, servers, and hypervisors - providing unified end-to-end visibility across the data center. The open networking model that Cumulus is pioneering offers exciting opportunities. Cumulus Linux allows popular open source server orchestration tools to also manage the network, and the combination of real-time, data center wide analytics with orchestration make it possible to create self-optimizing data centers.

Install and configure Host sFlow agent

The following command installs the Host sFlow agent on a Cumulus Linux switch:
sudo apt-get install hsflowd
Note: Network managers may find this command odd since it is usually not possible to install third party software on switch hardware. However, what is even more radical is that Cumulus Linux allows users to download source code and compile it on their switch. Instead of being dependent on the switch vendor to fix a bug or add a feature, users are free to change the source code and contribute the changes back to the community.

The sFlow agent requires very little configuration, automatically monitoring all switch ports using the following default settings:

Link SpeedSampling RatePolling Interval
1 Gbit/s1-in-1,00030 seconds
10 Gbit/s1-in-10,00030 seconds
40 Gbit/s1-in-40,00030 seconds
100 Gbit/s1-in-100,00030 seconds

Note: The default settings ensure that large flows (defined as consuming 10% of link bandwidth) are detected within approximately 1 second - see Large flow detection

Once the Host sFlow agent is installed, there are two alternative configuration mechanisms that can be used to tell the agent where to send the measurements:

1. DNS Service Discovery (DNS-SD)

This is the default configuration mechanism for Host sFlow agents. DNS-SD uses a special type of DNS record (the SRV record) to allow hosts to automatically discover servers. For example, adding the following line to the site DNS zone file will enable sFlow on all the agents and direct the sFlow measurements to an sFlow analyzer (10.0.0.1):
_sflow._udp 300 SRV 0 0 10.0.0.1
No Host sFlow agent specific configuration is required, each switch or host will automatically pick up the settings when the Host sFlow agent is installed, when the device is restarted, or if settings on the DNS server are changed.

Default sampling rates and polling interval can be overridden by adding a TXT record to the zone file. For example, the following TXT record reduces the sampling rate on 10G links to 1-in-2000 and the polling interval to 20 seconds:
_sflow._udp 300 TXT (
"txtvers=1"
"sampling.10G=2000"
"polling=20"
)
Note: Currently defined TXT options are described on sFlow.org.

The article DNS-SD describes how DNS service discovery allows sFlow agents to automatically discover their configuration settings. The slides DNS Service Discovery from a talk at the SF Bay Area Large Scale Production Engineering Meetup provide additional background.

 2. Configuration File

The Host sFlow agent is configured by editing the /etc/hsflowd.conf file. For example, the following configuration disables DNS-SD, instructs the agent to send sFlow to 10.0.0.1, reduces the sampling rate on 10G links to 1-in-2000 and the polling interval to 20 seconds:
sflow {
DNSSD = off

polling = 20
sampling.10G = 2000
collector {
ip = 10.0.0.1
}
}
The Host sFlow agent must be restarted for configuration changes to take effect:
sudu /etc/init.d/hsflowd restart
All hosts and switches can share the same settings and it is straightforward to use orchestration tools such as Puppet, Chef, etc. to manage the sFlow settings.

Collecting and analyzing sFlow

Figure 1: Visibility and the software defined data center
Figure 1 shows the general architecture of sFlow monitoring. Standard sFlow agents embedded within the elements of the infrastructure, stream essential performance metrics to management tools, ensuring that every resource in a dynamic cloud infrastructure is immediately detected and continuously monitored.

  • Applications -  e.g. Apache, NGINX, Tomcat, Memcache, HAProxy, F5, A10 ...
  • Virtual Servers - e.g. Xen, Hyper-V, KVM ...
  • Virtual Network - e.g. Open vSwitch, Hyper-V extensible vSwitch
  • Servers - e.g. BSD, Linux, Solaris and Windows
  • Network - over 40 switch vendors, see Drivers for growth

The sFlow data from a Cumulus switch contains standard Linux performance statistics in addition to the interface counters and packet samples that you would typically get from a networking device.

Note: Enhanced visibility into host performance is important on open switch platforms since they may be running a number of user installed services that can stress the limited CPU, memory and IO resources.

For example, the following sflowtool output shows the raw data contained in an sFlow datagram from a switch running Cumulus Linux:
startDatagram =================================
datagramSourceIP 10.0.0.160
datagramSize 1332
unixSecondsUTC 1402004767
datagramVersion 5
agentSubId 100000
agent 10.0.0.233
packetSequenceNo 340132
sysUpTime 17479000
samplesInPacket 7
startSample ----------------------
sampleType_tag 0:2
sampleType COUNTERSSAMPLE
sampleSequenceNo 876
sourceId 2:1
counterBlock_tag 0:2001
adaptor_0_ifIndex 2
adaptor_0_MACs 1
adaptor_0_MAC_0 6c641a000459
counterBlock_tag 0:2005
disk_total 0
disk_free 0
disk_partition_max_used 0.00
disk_reads 980
disk_bytes_read 4014080
disk_read_time 1501
disk_writes 0
disk_bytes_written 0
disk_write_time 0
counterBlock_tag 0:2004
mem_total 2056589312
mem_free 1100533760
mem_shared 0
mem_buffers 33464320
mem_cached 807546880
swap_total 0
swap_free 0
page_in 35947
page_out 0
swap_in 0
swap_out 0
counterBlock_tag 0:2003
cpu_load_one 0.390
cpu_load_five 0.440
cpu_load_fifteen 0.430
cpu_proc_run 1
cpu_proc_total 95
cpu_num 2
cpu_speed 0
cpu_uptime 770774
cpu_user 160600160
cpu_nice 192970
cpu_system 77855100
cpu_idle 1302586110
cpu_wio 4650
cpuintr 0
cpu_sintr 308370
cpuinterrupts 1851322098
cpu_contexts 800650455
counterBlock_tag 0:2006
nio_bytes_in 405248572711
nio_pkts_in 394079084
nio_errs_in 0
nio_drops_in 0
nio_bytes_out 406139719695
nio_pkts_out 394667262
nio_errs_out 0
nio_drops_out 0
counterBlock_tag 0:2000
hostname cumulus
UUID fd-01-78-45-93-93-42-03-a0-5a-a3-d7-42-ac-3c-de
machine_type 7
os_name 2
os_release 3.2.46-1+deb7u1+cl2+1
endSample ----------------------
startSample ----------------------
sampleType_tag 0:2
sampleType COUNTERSSAMPLE
sampleSequenceNo 876
sourceId 0:44
counterBlock_tag 0:1005
ifName swp42
counterBlock_tag 0:1
ifIndex 44
networkType 6
ifSpeed 0
ifDirection 2
ifStatus 0
ifInOctets 0
ifInUcastPkts 0
ifInMulticastPkts 0
ifInBroadcastPkts 0
ifInDiscards 0
ifInErrors 0
ifInUnknownProtos 4294967295
ifOutOctets 0
ifOutUcastPkts 0
ifOutMulticastPkts 0
ifOutBroadcastPkts 0
ifOutDiscards 0
ifOutErrors 0
ifPromiscuousMode 0
endSample ----------------------
startSample ----------------------
sampleType_tag 0:1
sampleType FLOWSAMPLE
sampleSequenceNo 1022129
sourceId 0:7
meanSkipCount 128
samplePool 130832512
dropEvents 0
inputPort 7
outputPort 10
flowBlock_tag 0:1
flowSampleType HEADER
headerProtocol 1
sampledPacketSize 1518
strippedBytes 4
headerLen 128
headerBytes 6C-64-1A-00-04-5E-E8-E7-32-77-E2-B5-08-00-45-00-05-DC-63-06-40-00-40-06-9E-21-0A-64-0A-97-0A-64-14-96-9A-6D-13-89-4A-0C-4A-42-EA-3C-14-B5-80-10-00-2E-AB-45-00-00-01-01-08-0A-5D-B2-EB-A5-15-ED-48-B7-34-35-36-37-38-39-30-31-32-33-34-35-36-37-38-39-30-31-32-33-34-35-36-37-38-39-30-31-32-33-34-35-36-37-38-39-30-31-32-33-34-35-36-37-38-39-30-31-32-33-34-35-36-37-38-39-30-31-32-33-34-35
dstMAC 6c641a00045e
srcMAC e8e73277e2b5
IPSize 1500
ip.tot_len 1500
srcIP 10.100.10.151
dstIP 10.100.20.150
IPProtocol 6
IPTOS 0
IPTTL 64
TCPSrcPort 39533
TCPDstPort 5001
TCPFlags 16
endSample ----------------------
While sflowtool is extremely useful, there are many other open source and commercial tools available, including:
Note: The sFlow Collectors list on sFlow.org contains a number of additional tools.

There is a great deal of variety among sFlow collectors - many focus on the network, others have a compute infrastructure focus, and yet others report on application performance. The shared sFlow measurement infrastructure delivers value in each of these areas. However, as network, storage, host and application resources are brought together and automated to create cloud data centers, a new set of sFlow analytics tools is emerging to deliver the integrated real-time visibility required to drive automation and optimize performance and efficiency across the data center.
While network administrators are likely to be familiar with sFlow, application development and operations teams may be unfamiliar with the technology. The 2012 O'Reilly Velocity conference talk provides an introduction to sFlow aimed at the DevOps community.
Cumulus Linux presents the switch as a server with a large number of network adapters, an abstraction that will be instantly familiar to anyone with server management experience. For example, displaying interface information on Cumulus Linux uses the standard Linux command:
ifconfig swp2
On the other hand, network administrators experienced with switch CLIs may find that Linux commands take a little time to get used to - the above command is roughly equivalent to:
show interfaces fastEthernet 6/1
However, the basic concepts of networking don't change and these skills are essential to designing, automating, operating and troubleshooting data center networks. Open networking platforms such as Cumulus Linux are an important piece of the automation puzzle, taking networking out of its silo and allowing a combined NetDevOps team to manage network, server, and application resources using proven monitoring and orchestration tools such as Ganglia, Graphite, Nagios, CFEngine, Puppet, Chef, Ansible, and Salt.

RESTful control of Cumulus Linux ACLs

$
0
0
Figure 1: Elephants and Mice
Elephant Detection in Virtual Switches & Mitigation in Hardware discusses a VMware and Cumulus demonstration, Elephants and Mice, in which the virtual switch on a host detects and marks large "Elephant" flows and the hardware switch enforces priority queueing to prevent Elephant flows from adversely affecting latency of small "Mice" flows.

This article demonstrates a self contained real-time Elephant flow marking solution that leverages the visibility and control features of Cumulus Linux.

SDN fabric controller for commodity data center switches provides some background on the capabilities of the commodity switch hardware used to run Cumulus Linux. The article describes how the measurement and control capabilities of the hardware can be used to maximize data center fabric performance:
Exposing the ACL configuration files through a RESTful API offers a straightforward method of remotely creating, reading, updating, deleting and listing ACLs.

For example, the following command creates a filter called ddos1 to drop a DNS amplification attack:
curl -H "Content-Type:application/json" -X PUT --data \
'["[iptables]",\
"-A FORWARD --in-interface swp+ -d 10.10.100.10 -p udp --sport 53 -j DROP"]' \
http://10.0.0.233:8080/acl/ddos1
The filter can be retrieved:
curl http://10.0.0.233:8080/acl/ddos1
The following command lists the filter names:
curl http://10.0.0.233:8080/acl/
The filter can be deleted:
curl -X DELETE http://10.0.0.233:8080/acl/ddos1
Finally, all filters can be deleted:
curl -X DELETE http://10.0.0.233:8080/acl/
Running the following Python script on the Cumulus switches provides a simple proof of concept implementation of the REST API:
#!/usr/bin/env python

from BaseHTTPServer import BaseHTTPRequestHandler,HTTPServer
from os import listdir,remove
from os.path import isfile
from json import dumps,loads
from subprocess import Popen,STDOUT,PIPE
import re

class ACLRequestHandler(BaseHTTPRequestHandler):
uripat = re.compile('^/acl/([a-z0-9]+)$')
dir = '/etc/cumulus/acl/policy.d/'
priority = '50'
prefix = 'rest-'
suffix = '.rules'
filepat = re.compile('^'+priority+prefix+'([a-z0-9]+)\\'+suffix+'$')

def commit(self):
Popen(["cl-acltool","-i"],stderr=STDOUT,stdout=PIPE).communicate()[0]

def aclfile(self,name):
return self.dir+self.priority+self.prefix+name+self.suffix

def wheaders(self,status):
self.send_response(status)
self.send_header('Content-Type','application/json')
self.end_headers()

def do_PUT(self):
m = self.uripat.match(self.path)
if None != m:
name = m.group(1)
len = int(self.headers.getheader('content-length'))
data = self.rfile.read(len)
lines = loads(data)
fn = self.aclfile(name)
f = open(fn,'w')
f.write('\n'.join(lines) + '\n')
f.close()
self.commit()
self.wheaders(201)
else:
self.wheaders(404)

def do_DELETE(self):
m = self.uripat.match(self.path)
if None != m:
name = m.group(1)
fn = self.aclfile(name)
if isfile(fn):
remove(fn)
self.commit()
self.wheaders(204)
elif '/acl/' == self.path:
for file in listdir(self.dir):
m = self.filepat.match(file)
if None != m:
remove(self.dir+file)
self.commit()
self.wheaders(204)
else:
self.wheaders(404)

def do_GET(self):
m = self.uripat.match(self.path)
if None != m:
name = m.group(1)
fn = self.aclfile(name)
if isfile(fn):
result = [];
with open(fn) as f:
for line in f:
result.append(line.rstrip('\n'))
self.wheaders(200)
self.wfile.write(dumps(result))
else:
self.wheaders(404)
elif '/acl/' == self.path:
result = []
for file in listdir(self.dir):
m = self.filepat.match(file)
if None != m:
name = m.group(1)
result.append(name)
self.wheaders(200)
self.wfile.write(dumps(result))
else:
self.wheaders(404)

if __name__ == '__main__':
server = HTTPServer(('',8080), ACLRequestHandler)
server.serve_forever()
Some notes on building a production ready solution:
  1. Add authentication
  2. Add error handling
  3. Script needs to run as a daemon
  4. Scaleability could be improved by asynchronously committing rules in batches 
  5. Latency could be improved through use of persistent connections (SPDY, websocket)
The following sFlow-RT controller application implements large flow marking using sFlow measurements from the switch and control of ACLs using the REST API:
include('extras/json2.js');

// Define large flow as greater than 100Mbits/sec for 1 second or longer
var bytes_per_second = 100000000/8;
var duration_seconds = 1;

var id = 0;
var controls = {};

setFlow('tcp',
{keys:'ipsource,ipdestination,tcpsourceport,tcpdestinationport',
value:'bytes', filter:'direction=ingress', t:duration_seconds}
);

setThreshold('elephant',
{metric:'tcp', value:bytes_per_second, byFlow:true, timeout:4,
filter:{ifspeed:[1000000000]}}
);

setEventHandler(function(evt) {
if(controls[evt.flowKey]) return;

var rulename = 'mark' + id++;
var keys = evt.flowKey.split(',');
var acl = [
'[iptables]',
'# mark Elephant',
'-t mangle -A FORWARD --in-interface swp+ -s ' + keys[0] + ' -d ' + keys[1]
+ ' -p tcp --sport ' + keys[2] + ' --dport ' + keys[3]
+ ' -j SETQOS --set-dscp 10 --set-cos 5'
];
http('http://'+evt.agent+':8080/acl/'+rulename,
'put','application/json',JSON.stringify(acl),null,null);
controls[evt.flowKey] = {
agent:evt.agent,
dataSource:evt.dataSource,
rulename:rulename,
time: (new Date()).getTime()
};
},['elephant']);

setIntervalHandler(function() {
for(var flowKey in controls) {
var ctx = controls[flowKey];
var val = flowValue(ctx.agent,ctx.dataSource + '.tcp',flowKey);
if(val < 100) {
http('http://'+ctx.agent+':8080/acl/'+ctx.rulename,'delete');
delete controls[flowKey];
}
}
},5);
The following command line argument load the script:
-Dscript.file=clmark.js
Some notes on the script:
  1. The 100Mbits/s threshold for large flows was selected because it represents 10% of the bandwidth of the 1Gigabit access ports on the network
  2. The setFlow filter specifies ingress flows since the goal is to mark flows as they enter the network
  3. The setThreshold filter specifies that thresholds are only applied to 1Gigabit access ports
  4. The event handler function triggers when new Elephant flows are detected, creating and installing an ACL to mark packets in the flow with a dscp value of 10 and a cos value of 5
  5. The interval handler function runs every 5 seconds and removes ACLs for flows that have completed
The iperf tool can be used to generate a sequence of large flows to test the controller:
while true; do iperf -c 10.100.10.152 -i 20 -t 20; sleep 20; done
The following screen capture shows a basic test setup and results:
The screen capture shows a mixture of small flows "mice" and large flows "elephants" generated by a server connected to an edge switch (in this case a Penguin Computing Arctica switch running Cumulus Linux). The graph at the bottom right shows the mixture of unmarked large and small flows arriving at the switch. The sFlow-RT controller receives a stream of sFlow measurements from the switch and detects each elephant flows in real-time, immediately installing an ACL that matches the flow and instructs the switch to mark the flow by setting the DSCP value. The traffic upstream of the switch is shown in the top right chart and it can be clearly seen that each elephant flow has been identified and marked, while the mice have been left unmarked.

Microsoft Office 365 outage

$
0
0
6/24/2014 Information Week - Microsoft Exchange Online Suffers Service Outage, "Service disruptions with Microsoft's Exchange Online left many companies with no email on Tuesday."

The following entry on the Microsoft 365 community forum describes the incident:
====================================

Closure Summary: On Tuesday, June 24, 2014, at approximately 1:11 PM UTC, engineers received reports of an issue in which some customers were unable to access the Exchange Online service. Investigation determined that a portion of the networking infrastructure entered into a degraded state. Engineers made configuration changes on the affected capacity to remediate end-user impact. The issue was successfully fixed on Tuesday, June 24, 2014, at 9:50 PM UTC.

Customer Impact: Affected customers were unable to access the Exchange Online service.

Incident Start Time: Tuesday, June 24, 2014, at 1:11 PM UTC

Incident End Time: Tuesday, June 24, 2014, at 9:50 PM UTC

=====================================
The closure summary shows that operators took 8 hour 39 minutes to manually diagnose and remediate the problem with degraded networking infrastructure. The network related outage described in this example is not an isolated incident; other incidents described on this blog include: Packet lossAmazon EC2 outageGmail outageDelay vs utilization for adaptive control, and Multi-tenant performance isolation.

The incidents demonstrate two important points:
  1. Cloud services are critically dependent on the physical network
  2. Manually diagnosing problems in large scale networks is a time consuming process that results in extended service outages.
The article, SDN fabric controller for commodity data center switches, describes how the performance and resilience of the physical core can be enhanced through automation. The SDN fabric controller leverages the measurement and control capabilities of commodity switches to rapidly detect and adapt to changing traffic, reducing response times from hours to seconds.

Docker performance monitoring

$
0
0
IT’S HERE: DOCKER 1.0 recently announced the first production release of the Docker Linux container platform. Docker is seeing explosive growth and has already been embraced by IBM, RedHat and RackSpace. Today the open source Host sFlow project released support for Docker, exporting standard sFlow performance metrics for Linux containers and unifying Linux containers with the broader sFlow ecosystem.
Visibility and the software defined data center
Host sFlow Docker support simplifies data center performance management by unifying monitoring of Linux containers with monitoring of virtual machines (Hyper-V, KVM/libvirt, Xen/XCP/XenServer), virtual switches (Open vSwitch, Hyper-V Virtual Switch, IBM Distributed Virtual Switch, HP FlexFabric Virtual Switch), servers (Linux, Windows, Solaris, AIX, FreeBSD), and physical networks (over 40 vendors, including: A10, Arista, Alcatel-Lucent, Arista, Brocade, Cisco, Cumulus, Extreme, F5, Hewlett-Packard, Hitachi, Huawei, IBM, Juniper, Mellanox, NEC, ZTE). In addition, standardizing metrics allows allows measurements to be shared among different tools, further reducing operational complexity.


The talk provides additional background on the sFlow standard and case studies. The remainder of this article describes how to use Host sFlow to monitor a Docker server pool.

First, download, compile and install the Host sFlow agent on a Docker host (Note: The agent needs to be built from sources since Docker support is currently in the development branch):
svn checkout http://svn.code.sf.net/p/host-sflow/code/trunk host-sflow-code
cd host-sflow-code
make DOCKER=yes
make install
make schedule
service hsflowd start
Next, if SE Linux is enabled, run the following commands to allow Host sFlow to retrieve network stats (or disable SE Linux):
audit2allow -a -M hsflowd
semodule -i hsflowd.pp
See Installing Host sFlow on a Linux server for additional information on configuring the agent.


The slide presentation describes how Docker can be used with Open vSwitch to create virtual networks connecting containers. In addition to providing advanced SDN capabilities, the Open vSwitch includes sFlow instrumentation, providing detailed visibility into network traffic between containers and to the outside network.

The Host sFlow agent makes it easy to enable sFlow on Open vSwitch. Simply enable the sflowovd daemon and Host sFlow configuration settings will be automatically applied to the Open vSwitch.
service sflowovsd start
There are a number of tools that consume and report on sFlow data and these should be able to report on Docker since the metrics being reported are the same standard set reported for virtual machines. Here are a few examples from this blog:
Looking at the big picture, the comprehensive visibility of sFlow combined with the agility of SDN and Docker lays the foundation for optimized workload placement, resource allocation, and scaling by the orchestration system, maximizing the utility of the physical network, storage and compute infrastructure.

DDoS mitigation with Cumulus Linux

$
0
0
Figure 1: Real-time SDN Analytics for DDoS mitigation
Figure 1 shows how service providers are ideally positioned to mitigate large flood attacks directed at their customers. The mitigation solution involves an SDN controller that rapidly detects and filters out attack traffic and protects the customer's Internet access.

This article builds on the test setup described in RESTful control of Cumulus Linux ACLs in order to implement the ONS 2014 SDN Idol winning distributed denial of service (DDoS) mitigation solution - Real-time SDN Analytics for DDoS mitigation.

The following sFlow-RT application implements basic DDoS mitigation functionality:
include('extras/json2.js');

// Define large flow as greater than 100Mbits/sec for 1 second or longer
var bytes_per_second = 100000000/8;
var duration_seconds = 1;

var id = 0;
var controls = {};

setFlow('udp_target',
{keys:'ipdestination,udpsourceport', value:'bytes',
filter:'direction=egress', t:duration_seconds}
);

setThreshold('attack',
{metric:'udp_target', value:bytes_per_second, byFlow:true, timeout:4,
filter:{ifspeed:[1000000000]}}
);

setEventHandler(function(evt) {
if(controls[evt.flowKey]) return;

var rulename = 'ddos' + id++;
var keys = evt.flowKey.split(',');
var acl = [
'[iptables]',
'# block UDP reflection attack',
'-A FORWARD --in-interface swp+ -d ' + keys[0]
+ ' -p udp --sport ' + keys[1] + ' -j DROP'
];
http('http://'+evt.agent+':8080/acl/'+rulename,
'put','application/json',JSON.stringify(acl));
controls[evt.flowKey] = {
agent:evt.agent,
dataSource:evt.dataSource,
rulename:rulename,
time: (new Date()).getTime()
};
},['attack']);

setIntervalHandler(function() {
for(var flowKey in controls) {
var ctx = controls[flowKey];
var val = flowValue(ctx.agent,ctx.dataSource + '.udp_target',flowKey);
if(val < 100) {
http('http://'+ctx.agent+':8080/acl/'+ctx.rulename,'delete');
delete controls[flowKey];
}
}
},5);
The following command line argument load the script:
-Dsflow.sumegress=yes -Dscript.file=clddos.js
Some notes on the script:
  1. The 100Mbits/s threshold for large flows was selected because it represents 10% of the bandwidth of the 1Gigabit access ports on the network
  2. The setFlow filter specifies egress flows since the goal is to filter flows as converge on customer facing egress ports
  3. The setThreshold filter specifies that thresholds are only applied to 1Gigabit access ports
  4. The interval handler function runs every 5 seconds and removes ACLs for flows that have completed
  5. The sflow.sumegress=yes option instructs sFlow-RT to synthesize egress totals based on the ingress sampled data
The nping tool can be used to simulate DDoS attacks to test the application. The following script simulates a series of DNS reflection attacks:
while true; do nping --udp --source-port 53 --data-length 1400 --rate 2000 --count 700000 --no-capture --quiet 10.100.10.151; sleep 40; done
The following screen capture shows a basic test setup and results:
The chart at the top right of the screen capture shows attack traffic mixed with normal traffic arriving at the edge switch. The switch sends a continuous stream of measurements to the sFlow-RT controller running the DDoS mitigation application. When an attack is detected, an ACL is pushed to the switch to block the traffic. The chart at the bottom right trends traffic on the protected customer link, showing that normal traffic is left untouched, but attack traffic is immediately detected and removed from the link.
Note: While this demonstration only used a single switch, the solution easily scales to hundreds of switches and thousands of edge ports.
This example, along with the large flow marking example, demonstrates that basing the sFlow-RT fabric controller on widely supported sFlow and HTTP/REST standards and including an open, standards based, programming environment (JavaScript / ECMAScript) makes sFlow-RT an ideal platform for rapidly developing and deploying traffic engineering SDN applications in existing networks.

HP proposes hybrid OpenFlow discussion at Open Daylight design forum

$
0
0
Hewlett-Packard, an Open Daylight platinum member, is proposing a discussion of integrated hybrid OpenFlow at the upcoming Open Daylight Developer Design Forum, September 29 - 30, 2014, Santa Clara.

Topics for ODL Design Summit from HP contains the following proposal, making the case for integrated hybrid OpenFlow:
We would like to share our experiences with Customer SDN deployments that require OpenFlow hybrid mode. Why it matters, implementation considerations, and how to achieve better support for it in ODL

OpenFlow-compliant switches come in two types: OpenFlow-only, and OpenFlow-hybrid. OpenFlow-only switches support only OpenFlow operation, in those switches all packets are processed by the OpenFlow pipeline, and cannot be processed otherwise. OpenFlow-hybrid switches support both OpenFlow operation and normal Ethernet switching operation, i.e. traditional L2 Ethernet switching, VLAN isolation, L3 routing (IPv4 routing, IPv6 routing...), ACL and QoS processing

The rationale for supporting hybrid mode is twofold:
  1. Controlled switches have decades of embedded traditional networking logic. The controller does not add value to a solution if it replicates traditional forwarding logic. One alternative controller responsibility is that provides forwarding decisions when it wants to override the traditional data-plane forwarding decision.
  2. Controllers can be gradually incorporated into a traditional network. The common approach to enterprise SDN assumes a 100% pure SDN-controlled solution from the ground-up. This approach is expensive in terms of actual cost of new switches and in terms of downtime of the network. By providing a controller that can gradually migrate to an SDN solution, the hybrid approach enables customers to start seeing the value of having an SDN controller without requiring them to make a huge leap in replacing their existing network.
The Open Networking Foundation (ONF), the body behind the OpenFlow standard, released Outcomes of the Hybrid Working Group in March 2013, concluding:
On the whole, the group determined that industry can address many of the issues related to the hybrid switch. ONF does not plan or intend to incorporate details of legacy protocols in OpenFlow. The priority of ONF in this context is to explore the migration of networks to OpenFlow.
OpenDaylight has broad industry participation and should be a good forum to discuss integrated hybrid OpenFlow use cases, enhance open source controller support, and address multi-vendor interoperability. HP should find support for integrated hybrid OpenFlow among Open Daylight members:
SDN fabric controller for commodity data center switches discusses a number of use cases where an SDN controller can leverage the hardware capabilities of commodity switches through industry standard sFlow and hybrid OpenFlow protocols.

Integrated hybrid OpenFlow is a practical method for rapidly creating and deploying compelling SDN solutions at scale in production networks. It's encouraging to see HP engaging the Open Daylight community to deliver solutions based on hybrid OpenFlow - hopefully their proposal will find the broad support it deserves and accelerate market adoption of hybrid OpenFlow based SDN.

SDN control of hybrid packet / optical leaf and spine network

$
0
0
9/19 DemoFriday: CALIENT, Cumulus Networks and InMon Demo SDN Optimization of Hybrid Packet / Optical Data Center Fabric demonstrated how network analytics can be used to optimize traffic flows across a network composed of bare metal packet switches running Cumulus Linux and Calient Optical Circuit switches.


The short video above shows how the Calient optical circuit switch (OCS) uses two grids of micro-mirrors to create optical paths. The optical switching technology has a number of interesting properties:
  • Pure optical cut-through, the speed of the link is limited only by the top of rack transceiver speeds (i.e. scales to 100G, 400G and beyond without having to upgrade the OCS)
  • Ultra low latency - less than 50ns
  • Lower cost than an equivalent packet switch
  • Ultra low power (50W vs. 6KW for comparable packet switch)
The challenge is integrating the OCS into a hybrid data center network design to leverage the strengths of both packet switching and optical switching technologies.

The diagram shows the hybrid network that was demonstrated. The top of rack switches are bare metal switches running Cumulus Linux. The spine layer consists of a Cumulus Linux bare metal switch and a Calient Technologies optical circuit switch. The bare metal switches implement hardware support for the sFlow measurement standard, and a stream of sFlow measurements is directed to an InMon's sFlow-RT real-time analytics engine, which detects and tracks large "Elephant" flows. The OCS controller combines the real-time traffic analytics with accurate topology information from Cumulus Networks'Prescriptive Topology Manager (PTM) and re-configures the packet and optical switches optimize the handling of the large flows - diverting them from the packet switch path (shown in green) to the optical circuit switch path (shown in blue).

The chart shows live data from the first use case demonstrated. A single traffic flow is established between servers. Initially the flow rate is small and the controller leaves it on the packet switch path. When the flow rate is increased, the increase is rapidly detected by the analytics software and the controller is notified. The controller then immediately sets up a dedicated optical circuit and diverts the flow to the newly created circuit.

The demonstration ties together a number of unique technologies from the participating companies:
  • Calient Technologies
    • Optical Circuit Switch provides low cost, low latency bandwidth on demand
    • OCS controller configures optimal paths for Elephant flow
  • Cumulus Networks
    • Cumulus Linux is the 1st true Linux Networking Operating System for low cost industry standard Open Networking switches
    • Prescriptive topology manager (PTM) provides accurate topology required for flow steering
    • Open Linux platform makes it easy to deploy visibility and control software to integrate the switches with the OCS controller.
  • InMon Corp.
    • Leverage sFlow measurement capabilities of bare metal switches
    • sFlow-RT analytics engine detects Elephant flows in real-time
To find out more and see the rest of the demo, look out for the full presentation recording and Q&A when it is posted on SDN Central in a couple of weeks. Other related articles include:

Super NORMAL

$
0
0
KennyK/Shutterstock
HP proposes hybrid OpenFlow discussion at Open Daylight design forum describes some of the benefits of integrated hybrid OpenFlow and the reasons why the OpenDaylight community would be a good venue for addressing operational and multi-vendor interoperability issues relating to hybrid OpenFlow.

HP's slide presentation from the design forum, OpenFlow-hybrid Mode, gives an overview of hybrid mode OpenFlow and its benefits. The advantage of hybrid mode in leveraging the proven scaleability and operational robustness of existing distributed control mechanisms and complementing them with centralized SDN control is compelling and a number of vendors have released support, including: Alcatel Lucent Enterprise, Brocade, Extreme, Hewlett-Packard, Mellanox, and Pica8. HP's presentation goes on to propose enhancements to the OpenDaylight controller to support hybrid OpenFlow agents.

InMon recently built a hybrid OpenFlow controller and, based on our experiences, this article will discuss how integrated hybrid mode is currently implemented on the switches, examine operational issues, and propose an agent profile for hybrid OpenFlow designed to reduce operational complexity, particularly when addressing traffic engineering use cases such as DDoS mitigation, large flow marking and large flow steering on ECMP/LAG networks.

Mechanisms for Optimizing LAG/ECMP Component Link Utilization in Networks is an IETF Internet Draft, authored by Brocade, Dell, Huawei, Tata, and ZTE that discussed the benefits and operational challenges of the flow steering use case. In particular:
6.2. Handling Route Changes
Large flow rebalancing must be aware of any changes to the FIB.  In cases where the nexthop of a route no longer to points to the LAG, or to an ECMP group, any PBR entries added as described in Section 4.4.1 and 4.4.2 must be withdrawn in order to avoid the creation of forwarding loops. 
The essential feature of hybrid OpenFlow is that it leverages the capabilities of existing routing, switching and link state mechanisms to handle traffic without controller intervention. The controller only needs to install rules when it wants to override the default behavior. However, hybrid OpenFlow, as currently implemented, does not fully integrate with the on-switch control plane, resulting in complex and unpredictable behavior that is hard to align with forwarding policy established through the on-switch control plane (BGP, ISIS, LACP, etc), particularly when steering flows.

In order to best understand the challenges, it is worth taking a look at the architecture of an OpenFlow agent.
Figure 1: OpenFlow 1.3 switch
Figure 1 shows the functional elements of an OpenFlow 1.3 agent. Multiple tables in the Data Plane are exposed through OpenFlow to the OpenFlow controller. Packets entering the switch pass from table to table, matching different packet headers. If there is no match, the packet is discarded, if there is a match, an associated set of actions is applied to the packet, typically forwarding the packet to a specific egress port on the switch. The key to hybrid OpenFlow is the NORMAL action:
Optional: NORMAL: Represents the traditional non-OpenFlow pipeline of the switch (see 5.1). Can be used only as an output port and processes the packet using the normal pipeline. If the switch cannot forward packets from the OpenFlow pipeline to the normal pipeline, it must indicate that it does not support this action.
With integrated hybrid OpenFlow, the agent is given a low priority default rule that matches all packets and applies an action to send them to the NORMAL port (i.e. apply forwarding rules determined by the switch's control plan). There are two ways that vendors have chosen to install this rule:
  1. Explicit The controller is responsible for installing the default NORMAL rule when the switch connects to it.
  2. Implicit The switch is configured to operate in integrated hybrid and behaves as if the default NORMAL rule was installed.
HP's OpenDaylight presentation describes enhancements to the OpenDaylight controller required to support the explicit hybrid OpenFlow configuration:
The controller would send a default rule which tells the switch to forward packets to the
NORMAL port. This rule delegates the forwarding decision to the controlled switches, but it means that the controller would receive ZERO packet_in messages if no other rules were pushed. For this reason, we’d put this rule at priority 0 in the last hardware OF table of the pipeline. Without this rule, the default behavior for OF 1.0 is to steal to the controller and the default behavior for OF 1.3 is to drop all packets.
Note: Integrated hybrid OpenFlow control of HP switches provides a simple example demonstrating integration between InMon's controller and HP switches.

Explicit configuration requires that the controller understand each vendor's forwarding pipeline and deploy an appropriate default rule. The implicit method supported by other vendors (e.g. Brocade, Alcatel Lucent Enterprise) is much simpler since the vendor takes responsibility for applying the default NORMAL rule at the appropriate point in the pipeline.

The implicit method also has a number of operational advantages:
  1. The rule exists at startup In the implicit case the switch will forward normally before the switch connects to a controller and the switch will successfully forward packets if the controller is down or fails. In the explicit case the switch will drop all traffic on startup and continue to drop traffic if it can't connect to the controller and get the NORMAL rule. 
  2. The rule cannot be deleted In the implicit case the default NORMAL isn't visible to the controller and can't be accidentally deleted (which would disable all forwarding on the switch). In the explicit case, the OpenFlow controller must add the rule and it may be accidentally deleted by an SDN application.
  3. The agent knows its in hybrid mode In the implicit case the switch is responsible for adding the default rule and knows its in hybrid mode. In the explicit case, there switch would need to examine the rules that the controller had inserted and try and infer the correct behavior. As we'll see later, the switch must be able to differentiate between hybrid mode and pure OpenFlow mode in order to trigger more intelligent behavior.
However, even in the implicit case, there are significant challenges with integrated hybrid OpenFlow as it is currently implemented. The main problem is that the demarcation of responsibility between the NORMAL forwarding logic and the OpenFlow controller isn't clearly specified. For example, a use case described in Mechanisms for Optimizing LAG/ECMP Component Link Utilization in Networks:
Within a LAG/ECMP group, the member component links with least average port utilization are identified.  Some large flow(s) from the heavily loaded component links are then moved to those lightly-loaded member component links using a policy-based routing (PBR) rule in the ingress processing element(s) in the routers.
Figure 2, from the OpenDaylight Dynamic Flow Management proposal expands on the SDN controller architecture for global large flow load balancing:
Figure 2: Large Flow Global Load Balancing
Suppose that the controller has detected a large flow collision and constructs the following OpenFlow rule to direct one of the flows to a different port:
node:{id:'00:00:00:00:00:00:00:01', type:'OF'},
etherType:'0x0800',
nwSrc: '10.0.0.1', nwDst: '10.1.10.2',
protocol: '6', tpSrc: '42344', tpDst: '80'
actions:['OUTPUT=2']
The rule will fail to have the desired effect because the NORMAL control plane in this network is ECMP routing. Successfully sending the packet on port 2 so that it reaches it's destination and doesn't interfere with the NORMAL forwarding protocols requires that the layer 2 headers be rewritten to set the VLAN to match port 2's VLAN, set the destination MAC address to match the next hop router's MAC address, the source MAC address to match port 2's MAC address, and finally decrementing the IP TTL.
node:{id:'00:00:00:00:00:00:00:01', type:'OF'},
etherType:'0x0800',
nwSrc: '10.0.0.1', nwDst: '10.1.10.2',
protocol: '6', tpSrc: '42344', tpDst: '80'
actions:[
'setDlSrc='00:04:00:00:00:02',
'setDlDst='00:04:00:00:02:02',
'setVLAN='1',
'decNwTTL',

'OUTPUT=2']
These additional actions involve information that is already known to the NORMAL control plane and which is difficult for the SDN controller to know. It gets even more complicated if you want to take routing and link state into account. The selected port may not represent a valid route, or the link may be down. In addition, routes may change and a rule that was once valid may become invalid and so must be removed (see 6.2. Handling Route Changes above).

Exposing hardware details makes sense if the external controller is responsible for all forwarding decisions (i.e. a pure OpenFlow environment). However, in a hybrid environment the NORMAL control plane is already populating the tables and the external controller should not need to concern itself with the hardware details.
Figure 3: Super NORMAL hybrid OpenFlow switch
Figure 3 proposes an alternative model for implementing integrated hybrid OpenFlow. It is referred to as "Super NORMAL" because it recognizes that the switch's forwarding agent is already managing the physical resources in the data plane and that the goal of integrated hybrid OpenFlow is integration with the forwarding agent, not direct control of the forwarding hardware. In this model a single OpenFlow table is exposed by the forwarding agent with keys and actions that can be composed with the existing control plane. In essence, the OpenFlow protocol is being used to manage forwarding policy, expressed as an OpenFlow table,  that is read by the Forwarding Agent and used to influence forwarding behavior.
Figure 4: SDN fabric controller for commodity data center switches
This model fits well with the hardware architecture, shown in Figure 4, of merchant silicon ASICs used in most current generation data center switches. The NORMAL control plane populates most of the tables in the ASIC and the forwarding agent can apply OpenFlow rules to the ACL Policy Flow Table to override default behavior. Many existing OpenFlow implementations are already very close to this model, but lack the integration needed to compose the OpenFlow rules with their forwarding method. The following enhancements to the hybrid OpenFlow agent would greatly improve the utility of hybrid OpenFlow:
  1. Implement implicit default NORMAL behavior
  2. Never generate Packet-In events (a natural result of implementing 1. above)
  3. Support NORMAL output action
  4. Expose a single table with matches and actions that are valid and compose with the configured forwarding protocol(s)
  5. Reject rules that are not valid options according to the NORMAL control plane:
    • if the NORMAL output would send a packet to a LAG and the specified port is not a member of the LAG, then the rule must be rejected.
    • if the NORMAL output would send a packet to an ECMP group and the specified port is not a member of the group then the rule must be rejected.
    • if the specified port is down then the rule must be rejected
    • if the rule cannot be fully implemented in the hardware data plane, then the rule must be rejected
  6. Remove rules that are no longer valid and send a flow removed message to the controller. A flow is not valid if it would be rejected (e.g. if a port goes down, rules directing traffic to that port must be immediately removed)
  7. Automatically add any required details needed to forward the traffic (e.g. rewrite source and destination mac addresses and decrement IP TTL if the packet is being routed)
Hybrid control of forwarding is the most complex operation and requires Super NORMAL functionality. Simpler operations such as blocking traffic or QoS marking are easily handled by the output DROP and NORMAL actions and solutions based on hybrid OpenFlow have been demonstrated:
Understanding the distinct architectural differences between hybrid and pure OpenFlow implementations is essential to get the most out of each approach to SDN. Pure OpenFlow is still an immature technology with limited applications. On the other hand, Hybrid OpenFlow works well with commodity switch hardware, leverages mature control plane protocols, and delivers added value in production networks.

SDN fabric controllers

$
0
0
Credit: sFlow.com
There is an ongoing debate in the software defined networking community about the functional split between a software edge and the physical core. Brad Hedlund argues the case in On choosing VMware NSX or Cisco ACI that a software only solution maximizes flexibility and creates fluid resource pools. Brad argues for a network overlay architecture that is entirely software based and completely independent of the underlying physical network. On the other hand, Ivan Pepelnjak argues in Overlay-to-underlay network interactions: document your hidden assumptions that the physical core cannot be ignored and, when you get past the marketing hype, even the proponents of network virtualization acknowledge the importance of the physical network in delivering edge services.

Despite differences, the advantages of a software based network edge are compelling and there is emerging consensus behind this architecture with  a large number of solutions available, including: Hadoop, Mesos, OpenStack, VMware NSX, Juniper OpenContrail, Midokura Midonet, Nuage Networks Virtual Services Platform, CPLANE Dynamic Virtual Networks and PLUMgrid Open Networking Suite.

In addition, the move to a software based network edge is leading to the adoption of configuration management and deployment tools from the DevOps community such as Puppet, Chef, Ansible, CFEngine, and Salt. As network switches become more open, these same tools are increasingly being used to manage switch configurations, reducing operational complexity and increasing agility by coordinating network, server, and application configurations.

The following articles from network virtualization proponents touch on the need for visibility and performance from the physical core:
While acknowledging the dependency on the underlying physical fabric, the articles don't offer practical solutions to deliver comprehensive visibility and automated management of the physical network to support the needs of a software defined edge.

In this evolving environment, how does software defined networking apply to the physical core and deliver the visibility and control needed to support the emerging software edge?
Credit: Cisco ACI
Cisco's Application Centric Infrastructure (ACI) is one approach. The monolithic Application Centric Infrastructure Controller (APIC) uses Cisco's OpFlex protocol to orchestrate networking, storage, compute and application services.

The recent announcement of Switch Fabric Accelerator (SFA) offers a modular alternative to Cisco ACI. The controller leverages open APIs to monitor and control network devices, and works with existing edge controllers and configuration management tools to deliver the visibility and control of physical network resources needed to support current and emerging edge services.

The following table compares the two approaches:

Cisco ACIInMon SFA
Switch vendorsCisco only - Nexus 9KInexpensive commodity switches from multiple vendors, including: Alcatel-Lucent Enterprise, Arista, Brocade, Cisco Nexus 3K, Cumulus, Dell, Edge-Core, Extreme, Huawei, IBM, HP, Juniper, Mellanox, NEC, Pica8, Pluribus, Quanta, ZTE
Switch hardwareCustom Application Leaf Engine (ALE) chip + merchant silicon ASICMerchant silicon ASICs from Broadcom, Intel or Marvell
Software vSwitchCisco Application Virtual Switch managed by Cisco APICAgnostic. Choose vSwitch to maximize functionality of edge. vSwitch is managed by edge controller.
Visibility
Analytics based on industry standard sFlow measurement
Boost throughputCisco proprietary ALE chip and proprietary VxLAN extensionControls based on industry standard sFlow measurement and hybrid control API
Reduce latencyCisco proprietary ALE chip and proprietary VxLAN extensionControls based on DSCP/QoS, industry standard measurement and hybrid control API
Limit impact of DDoS attacksControls based on industry standard sFlow measurements and hybrid control API
A loosely federated approach allows customers to benefit from a number of important trends: inexpensive bare metal / white box switches, rich ecosystem of edge networking software, network function virtualization, and well established DevOps orchestration tools. On the other hand, tight integration limits choice and locks customers into Cisco's hardware and ecosystem of partners, increasing cost without delivering clear benefits.

Open vSwitch 2014 Fall Conference

$
0
0

Open vSwitch is an open source software virtual switch that is popular in cloud environments such as OpenStack. Open vSwitch is a standard Linux component that forms the basis of a number of commercial and open source solutions for network virtualization, tenant isolation, and network function virtualization (NFV) - implementing distributed virtual firewalls and routers.

The recent Open vSwitch 2014 Fall Conference agenda included a wide variety speakers addressing a range of topics, including: large scale operation experiences at Rackspace, implementing stateful firewalls, Docker networking,  and acceleration technologies (Intel DPDK and Netmap/VALE).

The video above is a recording of the following sFlow related talk from the conference:
Traffic visibility and control with sFlow (Peter Phaal, InMon)
sFlow instrumentation has been included in Open vSwitch since version 0.99.1 (released 25 Jan 2010). This talk will introduce the sFlow architecture and discuss how it differs from NetFlow/IPFIX, particularly in regards to delivering real-time flow analytics to an SDN controller. The talk will demonstrate that sFlow measurements from Open vSwitch are identical to sFlow measurements made in hardware on bare metal switches, providing unified, end-to-end, measurement across physical and virtual networks. Finally, Open vSwitch / Mininet will be used to demonstrate Elephant flow detection and marking using a combination of sFlow and OpenFlow.
Slides and videos for all the conference talks will soon be available on the Open vSwitch web site.

Monitoring leaf and spine fabric performance

$
0
0

A leaf and spine fabric is challenging to monitor. The fabric spreads traffic across all the switches and links in order to maximize bandwidth. Unlike traditional hierarchical network designs, where a small number of links can be monitored to provide visibility, a leaf and spine network has no special links or switches where running CLI commands or attaching a probe would provide visibility. Even if it were possible to attach probes, the effective bandwidth of a leaf and spine network can be as high as a Petabit/second, well beyond the capabilities of current generation monitoring tools.

The 2 minute video provides an overview of some of the performance challenges with leaf and spine fabrics and demonstrates Fabric View - a monitoring solution that leverages industry standard sFlow instrumentation in commodity data center switches to provide real-time visibility into fabric performance. Fabric View is an application running on InMon's Switch Fabric Accelerator SDN controller. Other applications can automatically respond to problems and apply controls to protect against DDoS attacks, reduce latency and increase throughput.

Visit sFlow.comhttp://www.sflow.com/ to learn more, evaluate pre-release versions of these products, or discuss requirements.

InfluxDB and Grafana

$
0
0
Cluster performance metrics describes how to use sFlow-RT to calculate metrics and post them to Graphite. This article will describe how to use sFlow with the InfluxDB time series database and Grafana dashboard builder.

The diagram shows the measurement pipeline. Standard sFlow measurements from hosts, hypervisors, virtual machines, containers, load balancers, web servers and network switches stream to the sFlow-RT real-time analytics engine. Over 40 vendors implement the sFlow standard and compatible products are listed on sFlow.org. The open source Host sFlow agent exports standard sFlow metrics from hosts. For additional background, the Velocity conference talk provides an introduction to sFlow and case study from a large social networking site.
It is possible to simply convert the raw sFlow metrics into InfluxDB metrics. The sflow2graphite.pl script provides an example that can be modified to support InfluxDB's native format, or used unmodified with the InfluxDB Graphite input plugin. However, there are scaleability advantages to placing the sFlow-RT analytics engine in front of the time series database. For example, in large scale cloud environments the metrics for each member of a dynamic pool isn't necessarily worth trending since virtual machines are frequently added and removed. Instead, sFlow-RT tracks all the members of the pool, calculates summary statistics for the pool, and logs the summary statistics to the time series database. This pre-processing can significantly reduce storage requirements, reducing costs and increasing query performance. The sFlow-RT analytics software also calculates traffic flow metrics, hot/missed Memcache keys, top URLsexports events via syslog to Splunk, Logstash etc. and provides access to detailed metrics through its REST API
First install InfluxDB - in this case the software has been installed on host 10.0.0.30.

Next install sFlow-RT:
wget http://www.inmon.com/products/sFlow-RT/sflow-rt.tar.gz
tar -xvzf sflow-rt.tar.gz
cd sflow-rt
Edit the init.js script and add the following lines (modifying the dbURL to send metrics to the InfluxDB instance):
var dbURL = "http://10.0.0.30:8086/db/inmon/series?u=root&p=root";

setIntervalHandler(function() {
var metrics = ['min:load_one','q1:load_one','med:load_one',
'q3:load_one','max:load_one'];
var vals = metric('ALL',metrics,{os_name:['linux']});
var body = [];
for each (var val in vals) {
body.push({name:val.metricName,columns:['val'],points:[[val.metricValue]]})
;
}
http(dbURL,'post', 'application/json', JSON.stringify(body));
} , 15);
Now start sFlow-RT:
./start.sh
The script makes an sFlow-RT metrics() query every 15 seconds and posts the results to InfluxDB.
The screen capture shows InfluxDB's SQL like query language and a basic query demonstrating that the metrics are being logged in the database. However, the web interface is rudimentary and a dashboard builder simplifies querying and presentation of the time series data.

Grafana is a powerful HTML 5 dashboard building tool that supports InfluxDB, Graphite, and OpenTSDB.
The screen shot shows the Grafana query builder, offering simple drop down menus that make it easy to build complex charts. The resulting chart, shown below, can be combined with additional charts to build a custom dashboard.
The sFlow standard delivers the comprehensive instrumentation of data center infrastructure and is easily integrated with DevOps tools - see Visibility and the software defined data center

Stop thief!

$
0
0
The Host-sFlow project recently added added CPU steal to the set of CPU metrics exported.
steal (since Linux 2.6.11)
(8) Stolen time, which is the time spent in other operating systems
when running in a virtualized environment
Keeping close track of the stolen time metric is particularly import when running managing virtual machines in a public cloud. For example, Netflix and Stolen Time includes the discussion:
So how does Netflix handle this problem when using Amazon’s Cloud? Adrian admits that they tracked this statistic so closely that when an instance crossed a stolen time threshold the standard operating procedure at Netflix was to kill the VM and start it up on a different hypervisor. What Netflix realized over time was that once a VM was performing poorly because another VM was crashing the party, usually due to a poorly written or compute intensive application hogging the machine, it never really got any better and their best learned approach was to get off that machine.
The following articles describe how to monitor public cloud instances using Host sFlow agents:
The CPU steal metric is particularly relevant to Network Function Virtualization (NFV). Virtual appliances implementing network functions such as load balancing are particularly sensitive to stolen CPU cycles that can severely impact application response times. Application Delivery Controller (ADC) vendors export sFlow metrics from their physical and virtual appliances - sFlow leads convergence of multi-vendor application, server, and network performance management.  The addition of CPU steal to the set of sFlow metrics exported by virtual appliances will allow the NFV orchestration tools to better optimize service pools.
Viewing all 348 articles
Browse latest View live