Quantcast
Channel: sFlow
Viewing all 353 articles
Browse latest View live

SC13 large flow demo

$
0
0
For the duration of the SC13 conference, Denver will host of one of the most powerful and advanced networks in the world - SCinet. Created each year for the conference, SCinet brings to life a very high capacity network that supports the revolutionary applications and experiments that are a hallmark of the SC conference. SCinet will link the Colorado Convention Center to research and commercial networks around the world. In doing so, SCinet serves as the platform for exhibitors to demonstrate the advanced computing resources of their home institutions and elsewhere by supporting a wide variety of bandwidth-driven applications including supercomputing and cloud computing. - SCinet

The screen shot is from a live demonstration of network-wide large flow detection and tracking using standard sFlow instrumentation build into switches in the SCInet network. Currently multiple vendor's switches, 1,223 ports, with speeds up to 100Gbit/s, are sending sFlow data.
Note: The network is currently being set up, traffic levels will build up and reach a peak next week during the SC13 show (Nov. 17-22). Visit the demonstration site next week to see live traffic on one of the worlds busiest networks: http://inmon.sc13.org/dash/
The sFlow-RT real-time analytics engine is receiving the sFlow and centrally tracking large flows. The HTML5 web pages poll the analytics engine every half second for the largest 100 flows in order to update the charts, which represent large flows as follows:
  • Dot an IP address
  • Circle a logical grouping of IP addresses
  • Line width represents bandwidth consumed by flow
  • Line color identifies traffic type
Real-time detection and tracking of large flows has many applications in software defined networking (SDN), including: DDoS mitigation, large flow load balancing, and multi-tenant performance isolation. For more information, see Performance Aware SDN

Metric export to Graphite

$
0
0
Figure 1:Cluster performance metrics
Cluster performance metrics describes how sFlow-RT can be used to calculate summary metrics for cluster performance. The article includes a Python script that polls sFlow-RT's REST API and then sends metrics to to Graphite. In this article sFlow-RT's internal scripting API will be used to send metrics directly to Graphite.
Figure 2: Components of sFlow-RT
The following script (graphite.js) re-implements the Python example (generating a sum of the load_one metric for a cluster of Linux machines) in JavaScript using sFlow-RT built-in functions for retrieving metrics and sending them to Graphite:
// author: Peter
// version: 1.0
// date: 11/23/2013
// description: Log metrics to Graphite

include('extras/json2.js');

var graphiteServer = "10.0.0.151";
var graphitePort = null;

var errors = 0;
var sent = 0;
var lastError;

setIntervalHandler(function() {
var names = ['sum:load_one'];
var prefix = 'linux.';
var vals = metric('ALL',names,{os_name:['linux']});
var metrics = {};
for(var i = 0; i < names.length; i++) {
metrics[prefix + names[i]] = vals[i].metricValue;
}
try {
graphite(graphiteServer,graphitePort,metrics);
sent++;
} catch(e) {
errors++;
lastError = e.message;
}
} , 15);

setHttpHandler(function() {
var message = { 'errors':errors,'sent':sent };
if(lastError) message.lastError = lastError;
return JSON.stringify(message);
});
The interval handler function runs every 15 seconds and retrieves the set of metrics in the names array (in this case just one metrics, but multiple metrics could be retrieved). The names are then converted into a Graphite friendly form (prefixing each metric with the token linux. so that they can be easily grouped) and then sent to the Graphite collector running on 10.0.0.151 using the default TCP port 2003. The script also keeps track of any errors and makes them available through the URL /script/graphite.js/json

The following command line argument loads the script on startup:
-Dscript.file=graphite.js
The following Graphite screen capture below shows a trend of the metric:
There are a virtually infinite number of core and derived metrics that can be collected by sFlow-RT using standard sFlow instrumentation embedded in switches, servers and applications throughout the data center. For example Packet loss describes the importance of collecting network packet loss metrics and including them in performance dashboards.
Figure 2: Visibility and the software defined data center
While having access to all these metrics is extremely useful, not all of them need to be stored in Graphite. Using sFlow-RT to calculate and selectively export high value metrics reduces pressure on the time series database, while still allowing any of the remaining metrics to be polled using the REST API when needed.

Finally, metrics export is only one of many applications for sFlow data, some of which have been described on this blog. The data center wide visibility provided by sFlow-RT supports orchestration tools and allows them to automatically optimize the allocation of compute, storage and application resources and the placement of loads on these resources.

Exporting events using syslog

$
0
0
Figure 1:ICMP unreachable
ICMP unreachable described how standard sFlow monitoring built into switches can be used to detect scanning activity on the network. This article shows how sFlow-RT's embedded scripting API can be used to notify Security Information and Event Management (SIEM) tools when unreachable messages are observed.
Figure 2: Components of sFlow-RT
The following sFlow-RT JavaScript application (syslog.js) defines a flow to track ICMP port unreachable messages and generate syslog events that are sent to the SIEM tool running on server 10.0.0.152 and listening for UDP syslog events on the default syslog port (514):
var server = '10.0.0.152';
var port = 514;
var facility = 16; // local0
var severity = 5; // notice

var flowkeys = ['ipsource','ipdestination','icmpunreachableport'];

setFlow('uport', {
keys:'ipsource,ipdestination,icmpunreachableport',
value:'frames',
log:true,
flowStart:true
});

setFlowHandler(function(rec) {
var keys = rec.flowKeys.split(',');
var msg = {};
for(var i = 0; i < flowkeys.length; i++) msg[flowkeys[i]] = keys[i];

syslog(server,port,facility,severity,msg);
},['uport']);
The following command line argument loads the script on startup:
-Dscript.file=syslog.js
The following screen capture shows the events collected by the Splunk SIEM tool:
While Splunk was used in this example, there are a wide variety of open source and commercial tools that can be used to collect and analyze syslog events. For example, the following screen capture shows events in the open source Logstash tool:
Splunk, Logstash and other SIEM tools don't natively understand sFlow records and require a tool like sFlow-RT to extract information and convert it into a text format that can be processed. Using sFlow-RT to selectively forward high value data reduces the load on the SIEM system and in the case of commercial software like Splunk significantly lowers the expense of monitoring since licensing costs are typically based on the volume of data collected and indexed.

ICMP unreachable messages are only one example of the kinds of events that can be generated from sFlow data. The sFlow standard provides a scaleable method of monitoring all the network, server and application resources in the data center, see Visibility and the software defined data center.
Figure 3: Visibility and the software defined data center
For example, Cluster performance metrics describes how sFlow-RT can be used to summarize performance metrics, and periodic polling, or setting thresholds on metrics is another source of events for the SIEM system. A hybrid approach that splits the metrics stream so that exceptions are sent to the SIEM system and periodic summaries are sent to a time series database (e.g. Metric export to Graphite) leverages the strengths of the different tools.

Finally, log export is only one of many applications for sFlow data, some of which have been described on this blog. The data center wide visibility provided by sFlow-RT supports orchestration tools and allows them to automatically optimize the allocation of compute, storage and application resources and the placement of loads on these resources.

Integrated hybrid OpenFlow

$
0
0
Figure 1: Hybrid Programmable Forwarding Planes
Figure 1 shows two models for hybrid OpenFlow deployment, allowing OpenFlow to be used in conjunction with existing routing protocols. The Ships-in-the-Night model divides the switch into two, allocating selected ports to external OpenFlow control and the remaining ports are left to the internal control plane. It is not clear how useful this model is, other than for experimentation.

The Integrated hybrid model is much more interesting since it can be used to combine the best attributes of OpenFlow and existing distributed routing protocols to deliver a robust solutions. The OpenFlow 1.3.1 specification includes supports for the integrated hybrid model by defining the NORMAL action:
Optional:NORMAL: Represents the traditional non-OpenFlow pipeline of the switch (see 5.1). Can be used only as an output port and processes the packet using the normal pipeline. If the switch cannot forward packets from the OpenFlow pipeline to the normal pipeline, it must indicate that it does not support this action.
Hybrid solutions leverage the full capabilities of vendor and merchant silicon which efficiently support distributed forwarding protocols. In addition, most switch and merchant silicon vendors embed support for the sFlow standard, allowing the fabric controller to rapidly detect large flows and apply OpenFlow forwarding rules to control these flows.

Existing switching silicon is often criticized for the limited size of the hardware forwarding tables, supporting too few general match OpenFlow forwarding rules to be useful in production settings. However, consider that SDN and large flows defines a large flow as a flow that consumes 10% of a link's bandwidth. Using this definition, a 48 port switch would require a maximum of 480 general match rules in order to steer all large flows, well within the capabilities of current hardware (see OpenFlow Switching Performance: Not All TCAM Is Created Equal).

This article will use the Mininet testbed described in Controlling large flows with OpenFlow to experiment with using integrated hybrid forwarding to selectively control large flows, leaving the remaining flows to the switch's NORMAL forwarding pipeline.
Figure 2: MiniNet as an SDN test platform
The following command uses Mininet to emulate a simple topology with one switch and three hosts:
$ sudo mn --topo single,3 --controller=remote,ip=127.0.0.1
The next command enables sFlow on the switch:
sudo ovs-vsctl -- --id=@sflow create sflow agent=eth0  target=\"127.0.0.1:6343\" sampling=10 polling=20 -- -- set bridge s1 sflow=@sflow
Floodlight's Static Flow Pusher API will be used to insert OpenFlow rules in the switch. The default Floodlight configuration implements packet forwarding, disabling the forwarding module requires configuration changes:
  1. Copy the default properties file target/bin/floodlightdefault.properties to static.properties
  2. Edit the file to remove the line net.floodlightcontroller.forwarding.Forwarding,\
  3. Copy the floodlight.sh script to floodlight_static.sh
  4. Modify the last line of the script to invoke the properties, java ${JVM_OPTS} -Dlogback.configurationFile=${FL_LOGBACK} -jar ${FL_JAR} -cf static.properties
Start Floodlight with the forwarding module disabled:
cd floodlight
$ ./floodlight_static.sh
The following sFlow-RT script is based on the DDoS script described in Embedded SDN applications:
include('extras/json2.js');

var flowkeys = 'ipsource';
var value = 'frames';
var filter = 'outputifindex!=discard&direction=ingress&sourcegroup=external';
var threshold = 1000;
var groups = {'external':['0.0.0.0/0'],'internal':['10.0.0.2/32']};

var metricName = 'ddos';
var controls = {};
var enabled = true;
var blockSeconds = 20;

var flowpusher = 'http://localhost:8080/wm/staticflowentrypusher/json';

function clearOpenFlow() {
http('http://localhost:8080/wm/staticflowentrypusher/clear/all/json');
}

function setOpenFlow(spec) {
http(flowpusher, 'post','application/json',JSON.stringify(spec));
}

function deleteOpenFlow(spec) {
http(flowpusher, 'delete','application/json',JSON.stringify(spec));
}

function block(address) {
if(!controls[address]) {
setOpenFlow({name:'block-' + address, switch:'00:00:00:00:00:01',
cookie:'0', priority:'11', active: true,
'ether-type':'0x0800', 'src-ip': address, actions:""});
controls[address] = { action:'block', time: (new Date()).getTime() };
}
}

function allow(address) {
if(controls[address]) {
deleteOpenFlow({name:'block-' + address});
delete controls[address];
}
}

setEventHandler(function(evt) {
if(!enabled) return;

var addr = evt.flowKey;
block(addr);
},[metricName]);

setIntervalHandler(function() {
// remove stale controls
var stale = [];
var now = (new Date()).getTime();
var threshMs = 1000 * blockSeconds;
for(var addr in controls) {
if((now - controls[addr].time) > threshMs) stale.push(addr);
}
for(var i = 0; i < stale.length; i++) allow(stale[i]);
},10);

setHttpHandler(function(request) {
var result = {};
try {
var action = '' + request.query.action;
switch(action) {
case 'block':
var address = request.query.address[0];
if(address) block(address);
break;
case 'allow':
var address = request.query.address[0];
if(address) allow(address);
break;
case 'enable':
enabled = true;
break;
case 'disable':
enabled = false;
break;
}
}
catch(e) { result.error = e.message }
result.controls = controls;
result.enabled = enabled;
return JSON.stringify(result);
});

setGroups(groups);
setFlow(metricName,{keys:flowkeys,value:value,filter:filter});
setThreshold(metricName,{metric:metricName,value:threshold,byFlow:true,timeout:5});

clearOpenFlow();
setOpenFlow({name:'normal',switch:"00:00:00:00:00:01",cookie:"0",
priority:"10",active:true,actions:"output=normal"});
The following command line argument loads the script on startup:
-Dscript.file=normal.js
Some notes on the script:
  1. The intervalHandler() function is used to automatically release controls after 20 seconds
  2. The clearOpenFlow() function is used to remove any existing flow entries at startup
  3. The last line in the script defined the NORMAL forwarding action for all packets on the switch using a priority of 10
  4. Blocking rules are added for specific addresses using a higher priority of 11
Open a web browser to view a trend of traffic and then perform the following steps:
  1. disable the controller
  2. perform a simulated DoS attack (using a flood ping)
  3. enable the controller
  4. simulate a second DoS attack

Figure 3: DDoS attack traffic with and without controller
Figure 3 shows the results of the demonstration. When the controller is disabled, the attack traffic exceeds 6,000 packets per second and persists until the attacker stops sending. When the controller is enabled, traffic is stopped the instant it hits the 1,000 packet per second threshold in the application. The control is removed 20 seconds later and re-triggers if the attacker is still sending traffic.

DDoS mitigation is only one use case large flow control, others described on this blog include: ECMP / LAG load balancing, traffic marking and packet capture. This script can be modified to address these different use cases. The Mininet test bed provides a useful way to test hybrid OpenFlow control schemes before moving them into production using physical switches that support integrated hybrid OpenFlow.

ovs-ofctl

$
0
0
The ovs-ofctl command line tool that ships with Open vSwitch provides a very convenient way to interact with OpenFlow forwarding rules, not just with Open vSwitch, but with any switch that can be configured to accept passive connections from an OpenFlow controller.

This article looks takes the example in Integrated hybrid OpenFlow and repeats it without an OpenFlow controller, using ovs-ofctl instead.

First start Mininet without a controller and configure the switch to listen for OpenFlow commands:
sudo mn --topo single,3 --controller none --listenport 6633
Next use enable normal forwarding in the switch:
ovs-ofctl add-flow tcp:127.0.0.1 priority=10,action=normal
The following command blocks traffic from host 1 (10.0.0.1):
ovs-ofctl add-flow tcp:127.0.0.1 priority=11,dl_type=0x0800,nw_src=10.0.0.1,action=drop
The following command removes the block:
ovs-ofctl --strict del-flows tcp:127.0.0.1 priority=11,dl_type=0x0800,nw_src=10.0.0.1
Finally, modify the controller script with the following block() and allow() functions:
function addFlow(spec) {
runCmd(['ovs-ofctl','add-flow','tcp:127.0.0.1',spec.join(',')]);
}

function removeFlow(spec) {
runCmd(['ovs-ofctl','--strict','del-flows','tcp:127.0.0.1',spec.join(',')]);
}

function block(address) {
if(!controls[address]) {
addFlow(['priority=11','dl_type=0x0800','nw_src=' + address,'action=drop']);
controls[address] = { action:'block', time: (new Date()).getTime() };
}
}

function allow(address) {
if(controls[address]) {
removeFlow(['priority=11','dl_type=0x0800','nw_src=' + address]);
delete controls[address];
}
}
Moving from Mininet to a production setting is simply a matter of modifying the script to connect to the remote switch, configuring the switch to listen for OpenFlow commands, and configuring the switch to send sFlow data to sFlow-RT.

DDoS mitigation is only one use case for large flow control, others described on this blog include: ECMP / LAG load balancing, traffic marking and packet capture. This script can be modified to address these different use cases. The Mininet test bed provides a useful way to test hybrid OpenFlow control schemes before moving them into production using physical switches that support integrated hybrid OpenFlow and sFlow.

Blacklists

$
0
0
Blacklists are an important way in which the Internet community protects itself by identifying bad actors. However, before using a blacklist, it is important to understand how it is compiled and maintained in order to properly use the list and interpret the significance of a match.

Incorporating blacklists in traffic monitoring can be a useful way to find hosts on a network that have been compromised. If a host interacts with addresses known to be part of a botnet for example, then it raises the concern that the host has been compromised and is itself a member of the botnet.

This article provides an example that demonstrates how the standard sFlow instrumentation build into most vendors switches can be used match traffic against a large blacklist. Black lists can be very large, the list used in this example contains approximately 16,000 domain names and nearly 300,000 CIDRs. Most switches don't have the resources to match traffic against such large lists. However, the article RESTflow describes how sFlow shifts analysis from the switches to external software which can easily handle to task of matching traffic against large lists. This article uses sFlow-RT to perform the black list matching.
Figure 1: Components of sFlow-RT
The following sFlow-RT script (phish.js) makes use of the PhishTank blacklist to identify hosts that may have been compromised by phishing attacks:
include('extras/json2.js');

var server = '10.0.0.1';
var port = 514;
var facility = 16; // local0
var severity = 5; // notice

var domains = {};
function updatePhish() {
var phish = JSON.parse(http("http://data.phishtank.com/data/online-valid.json"));
domains = {};
var dlist = [];
var groups = {};
for(var i = 0; i < phish.length; i++) {
var entry = phish[i];
var target = entry.target;
var id = entry.phish_id;
var url = entry.url;
var dnsqname = url.match(/:\/\/(.[^/]+)/)[1] + '.';
if(!domains[dnsqname]) {
domains[dnsqname] = id;
dlist.push(dnsqname);
}
var details = entry.details;
var cidrlist = [];
for(var j = 0; j < details.length; j++) {
var ip = details[j].ip_address;
var cidr = details[j].cidr_block;
if(cidr) cidrlist.push(cidr);
}
if(cidrlist.length > 0) groups["phish." + id] = cidrlist;
}

// add in local groups
groups.other = ['0.0.0.0/0','::/0'];
groups.private = ['10.0.0.0/8','172.16.0.0/12','192.168.0.0/16','FC00::/7'];
groups.multicast = ['224.0.0.0/4'];
setGroups(groups);

setFlow('phishydns',
{
keys:'ipsource,ipdestination,dnsqname,dnsqr',
value:'frames',
filter:'dnsqname="'+ dlist + '"',
log:true,
flowStart:true
}
);
}

setFlowHandler(function(rec) {
var keys = rec.flowKeys.split(',');
var msg = {type:'phishing'};
switch(rec.name) {
case 'phishysrc':
msg.victim=keys[0];
msg.match='cidr';
msg.phish_id = keys[1].split('.')[1];
break;
case 'phishydst':
msg.victim=keys[0];
msg.match='cidr';
msg.phish_id = keys[1].split('.')[1];
break;
case 'phishydns':
var id = domains[keys[2]];
msg.victim = keys[3] == 'false' ? keys[0] : keys[1];
msg.match = 'dns';
msg.phish_id = domains[keys[2]];
break;
}
syslog(server,port,facility,severity,msg);
},['phishysrc','phishydst','phishydns']);


updatePhish();

// update threat database every 24 hours
setIntervalHandler(function() {
try { updatePhish(); } catch(e) {}
},60*60*24);

setFlow('phishysrc',
{
keys:'ipsource,destinationgroup',
value:'frames',
filter:'destinationgroup~^phish.*',
log:true,
flowStart:true
}
);

setFlow('phishydest',
{
keys:'ipdestination,sourcegroup',
value:'frames',
filter:'sourcegroup~^phish.*',
log:true,
flowStart:true
}
);
The following command line arguments should be added to sFlow-RT's start.sh in order to load the script on startup and allocate enough memory to allow the blacklists to be loaded:
-Xmx2000m -Dscript.file=phish.js
A few notes about the script:
  1. The script uses sFlow-RT's setGroups() function to efficiently classify and group IP addresses based on CIDR lists.
  2. The large number of DNS names used in the DNS filter is efficiently compiled and does not impact performance.
  3. The script makes an HTTP call to retrieve updated signatures every 24 hours. If more frequent updates are required then a developer key should be obtained, see Developer Information.
  4. Matches are exported using syslog(), see Exporting events using syslog. The script could easily be modified to post events into other systems, or take control actions, by using the http() function to interact with RESTful APIs.
Network virtualization poses interesting monitoring challenges since compromised hosts may be virtual machines and their traffic may be carried over tunnels (VxLAN, GRE, NVGRE etc.) across the physical network. Fortunately, sFlow monitoring intrinsically provides good visibility into tunnels (see Tunnels) and the sFlow-RT script could easily be modified to examine flows within the tunnels (see Down the rabbit hole) and report inner IP addresses and virtual network identifiers (VNI) for compromised hosts. In addition most virtual switches also support sFlow monitoring, providing direct visibility into inter virtual machine traffic.

Blacklist matching is only one use case for sFlow monitoring - many others have been described on this blog. The ability to pervasively monitor high speed networks at scale and deliver continuous real-time visibility is transformative, allowing many otherwise difficult or impossible tasks to be accomplished with relative ease.

Workload placement

$
0
0
Messy and organized closets are an every day example of the efficiency that can be gained by packing items together in a systematic way: randomly throwing items in a closet makes poor use of the space; keeping the closet organized increases the available space.

A recent CBS 60 Minutes Amazon segment describes the ultimate closet - an Amazon order fulfillment warehouse. Each vast warehouse looks like a chaotic jumble - something out of Raiders of the Lost Ark.
Even when you get up close to an individual shelf, there still appears to be no organizing principle. Interviewer Charlie Rose comments, "The products are then placed by stackers in what seems to outsiders as a haphazard way… a book on Buddhism and Zen resting next to Mrs. Potato Head…"
Amazon's Dave Clark explains, "Can those two things, you look at how these items fit in the bin. They’re optimized for utilizing the available space. And we have computers and algorithmic work that tells people the areas of the building that have the most space to put product in that’s coming in at that time. Amazon has become so efficient with its stacking, it can now store twice as many goods in its centers as it did five years ago."

The 60 Minutes piece goes on to discuss Amazon Web Services (AWS). There are interesting parallels between managing a cloud data center and managing a warehouse (both of which Amazon does extremely well). There is a fixed amount of physical compute, storage and bandwidth resources in the data center, but instead of having to find shelf space to store physical goods, the data center manager needs to find a server with enough spare capacity to run each new virtual machine.

Just as a physical object has a size, shape and weight that constrain where it can be placed, virtual machines have characteristics such as number of virtual CPUs, memory, storage and network bandwidth that determine how many virtual machines can be placed on each physical server (see Amazon EC2 Instances). For example, an Amazon m1.small instance provides 1 virtual CPU, 1.7 GiB RAM, and 160 GB storage. A simplistic packing scheme would allow 6 small instances to be hosted on a physical server with 8 CPU cores, 32 GiB RAM, and 1 TB disk. This allocation scheme is limited by the amount of disk space and leaves CPU cores and RAM unused.

While the analogy between a data center and a warehouse is interesting, there are distinct differences between computational workloads and physical goods that are important to consider. One of the motivating factors driving the move to virtualization was the realization that most physical servers were poorly utilized. Moving to virtual machines allowed multiple workloads to be combined and run on a single physical server, increasing utilization and reducing costs. Continuing the EC2 example, if measurement revealed that the m1.small instances where only using 80GB of storage, additional instances could be placed on the server by over subscribing the storage.
The Wired article, Return of the Borg: How Twitter Rebuilt Google’s Secret Weapon, describes Google's internally developed workload packing software and the strategic value it has for Google's business.
Amazon has been able to double the capacity of their physical warehouses by using bar code tracking and computer orchestration algorithms. Assuming analytics driven workload placement in data centers can drive a similar increase workload density, what impact would that have for a cloud hosting provider?

Suppose a data center is operating with a gross margin of 20%. Leveraging the sFlow standard for measurement doesn't add to costs since the capability is embedded in most vendor's data center switches, and open source sFlow agents can easily be deployed on hypervisors using orchestration tools. Real-time analytics software is required to turn the raw measurements into actionable data, however, the cost of this software is a negligible part of the overall cost of running the data center. On the other hand, doubling the number of virtual machines that can be hosted in the data center (and assuming that there is sufficient demand to fill this additional capacity) doubles the top line revenue and triples the gross margin to 60%.

One can argue about the assumptions in the example, but playing around with different assumptions and models, it is clear that workload placement has great potential for increasing the efficiency and profitability of cloud data centers. Where the puck is going: analytics describes the vital role for analytics in SDN orchestration stacks, including: VMware (NSX), Cisco, Open Daylight, etc. The article predicts that there will be increase merger and acquisition activity in 2014 as orchestration vendors compete by integrating analytics into their platforms.

Finally, while analytics offers attractive opportunities, a lack of visibility and poorly placed workloads carries significant risks. In SDN market predictions for New Year: NFV, OpenFlow, Open vSwitch boom, Eric Hanselman of 451 Research poses the question, "Will data center overlays hit a wall in 2014?" He then goes on to state, "There is a point at which the overlay is going to be constrained by the mechanics of the network underneath... Data center operators will want the ability to do dynamic configuration and traffic management on the physical network and tie that management and control into application-layer orchestration."

Drivers for growth

$
0
0
This article examines the factors that are continuing to accelerate adoption of the sFlow measurement standard as the universal source of analytics in the data center, including: rising popularity of merchant silicon based switches, open switch operating systems and platforms, virtual switching, network virtualization, and integration of real-time sFlow analytics in orchestration stacks to create automated self-optimizing data centers.
Two years ago the article Merchant silicon described the broad adoption of the Broadcom Trident ASIC by switch vendors. This trend is picking up pace with the rapid adoption of the new Trident II ASIC (announced last year, but only available in volume this Fall). Vendors don't typically disclose when they use merchant silicon, however, based on news reports, similarities in specifications and rumors, the following switches appear to use Broadcom Trident II chipsets: Extreme Summit X770, HP 5930, Dell S6000, Cumulus HCL partners (Agema, Edge-Core, Penguin Computing and Quanta), Arista 7250X and 7500E series, Cisco Nexus 3100 and 9000 series, Juniper QFX 3500 series and Nuage 7850 VSG.
Note: While most of the Broadcom based switches listed already support sFlow, a few vendors have yet to enable the feature in their firmware. If you have, or are considering, Broadcom based switches in your data center, ask your vendor when they plan to enable sFlow. A list of switches with sFlow support is maintained on sFlow.org.
Merchant silicon lowers the barriers to entering the networking market in much the same way as standardizing on x86 compute platforms commoditized hardware and made it possible for a large number of PC manufacturers to emerge. The second component driving this trend is the availability of switch operating systems (Broadcom FASTPATHCumulus Linux, Big Switch's Switch Light Linux, Pluribus OpenNetvisor, Pica8 PicOS, etc.) that further reduce the barrier to entry. Another project to watch is the Open Compute Project's efforts to define an open switch hardware platform - if successful, it will create high volume standard hardware platform and competition between hardware vendors that will drive down hardware costs and increase the market for switch operating systems and the ecosystem of software running on those platforms - analogous to Windows and Linux running on x86 and their respective application ecosystems.
The slide from Bruce Davie's keynote address at Open Server Summit 2013, Network Virtualization: What it is, Why it Matters, shows the rapid transition from a physical edge in which physical servers are attached to physical switch ports, to a virtual edge in which virtual machines are attached to virtual switches. Second generation virtual switches are starting to enter the market, delivering increased performance and integrating support for overlays and network virtualization. In SDN market predictions for New Year: NFV, OpenFlow, Open vSwitch boom, Eric Hanselman, chief analyst at 451 Research states, "The improved scalability of Open vSwitch 2.0 will affect the numerous SDN vendors who use it as an OpenFlow agent on switches or as an endpoint in overlay technologies. These vendors include high-profile players such as VMware Inc. and startups such as Midokura and Pica8."

Accelerating adoption of virtual switching is helping to drive sFlow growth since support for the standard is integrated in virtual switches:
The article Visibility and the software defined data center describes how the sFlow standard has been extended to include not just the network, but server and application resources as well. For example, growing support for sFlow in web servers (Apache, NGINX, Tomcat) and load balancers (F5 BIG IP, HAproxy) extends visibility to include application response time, URLs, response codes etc. Best of Velocity 2012: The sFlow Standard describes how sFlow analytics integrate into the DevOps tool stack to provide scaleable, real-time monitoring of application resources.
So far this article has described the widespread support for the sFlow measurement standard within the data center infrastructure. The remainder of the article explores the rise in automation and the vital role that real-time analytics is poised to play in orchestration stacks.

As SDN solutions move from pilot to large scale deployments, attention is shifting from using SDN merely to configure networking, to optimizing performance and increasing efficiency. There is also a clear move to an integrated view of orchestration that includes networking, servers, storage and applications, going beyond SDN to create what VMware calls the Software Defined Data Center (SDDC), Cisco terms the Application Centric Infrastructure (ACI), and Microsoft refers to as the Cloud OS.

The following articles demonstrate the growing awareness among industry leaders about the importance of analytics as they develop their cloud orchestration controllers:
  1. Of Mice and Elephants by Martin Casado and Justin Pettit with input from Bruce Davie, Teemu Koponen, Brad Hedlund, Scott Lowe, and T. Sridhar - VMware
  2. Software Defined Networking on VMWare with Scott Lowe on RunAs Radio - VMware
  3. How Software-defined Networking is rewriting the rules of application delivery by Senior Vice President and General Manager, HP Networking - Hewlett-Packard
  4. Networking Without Limits: SDN by Brad Anderson, Corporate Vice President, Windows Server & System Center - Microsoft
  5. Where the puck is going: analytics by Mike Bushong - Plexxi
  6. Wandl and Cariden: Is There a Real Value? by Tom Nolle - CIMI Corp.
The article Workload placement describes this author's take on the strategic value of analytics and orchestration as a way to transform the economics of cloud computing by more densely packing workloads in the data center.
Recent breakthroughs in real-time sFlow analysis incorporated in the sFlow-RT analytics engine delivers timely, comprehensive, and actionable metrics through a programmatic interface. Expect to see this technology incorporated in next generation self optimizing orchestration solutions in 2014.
Performance Aware SDN describes the theory behind analytics driven orchestration. The talk describes how fast controller response, programmatic configuration interfaces such as OpenFlow, and consistent instrumentation of all the elements being orchestrated are pre-requisites for feedback control.
The requirement for complete measurement coverage by next generation orchestration systems will create a strong demand for sFlow instrumented infrastructure since sFlow is the only widely supported multi-vendor standard that spans network, server and application resources and delivers the low latency and scaleability required for adaptive control.

OpenDaylight

$
0
0
This article looks takes the DDoS example and repeats it using the OpenDaylight controller.

First install Open Daylight in the Mininet testbed.
$ wget https://jenkins.opendaylight.org/controller/job/controller-merge/lastSuccessfulBuild/artifact/opendaylight/distribution/opendaylight/target/distribution.opendaylight-osgipackage.zip
unzip distribution.opendaylight-osgipackage.zip
Next start Mininet.
sudo mn --topo single,3 --controller=remote,ip=127.0.0.1
Enable sFlow on the switch:
sudo ovs-vsctl -- --id=@sflow create sflow agent=eth0  target=\"127.0.0.1:6343\" sampling=10 polling=20 -- -- set bridge s1 sflow=@sflow
Start OpenDaylight.
cd opendaylight
./run.sh
Confirm that the controller is running and has discovered the switch by connecting a browser to port 8080 on the testbed - the screen shot at the start of the article shows the OpenDaylight Devices tab with the switch 00:00:00:00:00:00:00:01 shown in the Nodes Learned list and in the map (the default credentials to log into the OpenDaylight interface are User:admin, Password:admin).

The following sFlow-RT script modified the original to use the OpenDaylight Flow Programmer REST API to push OpenFlow rules to the switch.
include('extras/json2.js');

var flowkeys = 'ipsource';
var value = 'frames';
var filter = 'outputifindex!=discard&direction=ingress&sourcegroup=external';
var threshold = 1000;
var groups = {'external':['0.0.0.0/0'],'internal':['10.0.0.2/32']};

var metricName = 'ddos';
var controls = {};
var enabled = true;
var blockSeconds = 20;
var ruleid = 0;

var flowprogrammer = 'http://127.0.0.1:8080/controller/nb/v2/flowprogrammer/default/node/OF/';
var user = 'admin';
var password = 'admin';
var bridge = '00:00:00:00:00:00:00:01';

function setOpenFlow(bridge,name,spec) {
http(flowprogrammer+bridge+'/staticFlow/'+name,'put','application/json',
JSON.stringify(spec),user,password);
}

function deleteOpenFlow(bridge,name) {
http(flowprogrammer+bridge+'/staticFlow/'+name,'delete','application/json',
null,user,password);
}

function block(address) {
if(!controls[address]) {
var name = 'block' + ruleid++;
setOpenFlow(bridge,name,{installInHw:true,name:name,
node:{id:bridge, type:'OF'},
priority:'11', etherType:'0x0800',
nwSrc: address, actions:['DROP']});
controls[address] = { name: name, action:'block',
time: (new Date()).getTime() };
}
}

function allow(address) {
if(controls[address]) {
deleteOpenFlow(bridge,controls[address].name);
delete controls[address];
}
}

setEventHandler(function(evt) {
if(!enabled) return;

var addr = evt.flowKey;
block(addr);
},[metricName]);

setIntervalHandler(function() {
// remove stale controls
var stale = [];
var now = (new Date()).getTime();
var threshMs = 1000 * blockSeconds;
for(var addr in controls) {
if((now - controls[addr].time) > threshMs) stale.push(addr);
}
for(var i = 0; i < stale.length; i++) allow(stale[i]);
},10);

setHttpHandler(function(request) {
var result = {};
try {
var action = '' + request.query.action;
switch(action) {
case 'block':
var address = request.query.address[0];
if(address) block(address);
break;
case 'allow':
var address = request.query.address[0];
if(address) allow(address);
break;
case 'enable':
enabled = true;
break;
case 'disable':
enabled = false;
break;
}
}
catch(e) { result.error = e.message }
result.controls = controls;
result.enabled = enabled;
return JSON.stringify(result);
});

setGroups(groups);
setFlow(metricName,{keys:flowkeys,value:value,filter:filter});
setThreshold(metricName,{metric:metricName,value:threshold,byFlow:true,timeout:5});
The following command line argument loads the script on startup:
-D file.script=odl.js
Repeating the simulated denial of service attack without the controller active and with the controller active shows the same results demonstrated in the previous article:
When the controller is disabled, the attack traffic exceeds 6,000 packets per second and persists until the attacker stops sending. When the controller is enabled, traffic is stopped the instant it hits the 1,000 packet per second threshold in the application. The control is removed 20 seconds later and re-triggers if the attacker is still sending traffic.

DDoS mitigation is only one use case for large flow control, others described on this blog include: ECMP / LAG load balancing, traffic marking and packet capture. This script can be modified to address these different use cases. The Mininet test bed provides a useful way to test OpenFlow control schemes before moving them into production using physical switches.

Configuring Alcatel-Lucent switches

$
0
0
The following configuration enables sFlow monitoring of all interfaces on an Alcatel-Lucent OmniSwitch switch (10.0.0.235), sampling packets at 1-in-512, polling counters every 30 seconds and sending the sFlow to an analyzer (10.0.0.1) on UDP port 6343 (the default sFlow port):
sflow agent ip 10.0.0.235
sflow receiver 1 name InMon address 10.0.0.1 udp-port 6343
sflow sampler 1 port 1/1-20 receiver 1 rate 512
sflow poller 1 port 1/1-20 receiver 1 interval 30
The switches also support the sFlow MIB for configuration.

See Trying out sFlow for suggestions on getting started with sFlow monitoring and reporting.

Alcatel-Lucent OmniSwitch analytics driven control

$
0
0
There are a many articles on this blog that demonstrate how real-time sFlow analytics driven control of switches using a Mininet testbed. This article is the first of a series that will shift the focus to physical switches and demonstrate different techniques for adapting network behavior to changing traffic.
Performance Aware SDN describes the theory behind analytics driven orchestration. The talk describes how fast controller response, programmatic configuration interfaces and consistent instrumentation of all the elements being orchestrated are pre-requisites for feedback control.
This article uses an Alcatel-Lucent OmniSwitch 6900 as an example. The switch has hardware sFlow support for line rate visibility on all ports, and support for OpenFlow and a RESTful configuration API to deploy control actions. In this example a basic DDoS mitigation filtering function will be triggered when large flood attacks are detected. The script is based on the version described in the article Integrated hybrid OpenFlow, but modified to use the OmniSwitch RESTful API.
RESTful control of switches describes how RESTFul configuration access to switches can be used to develop simple, controller-less SDN solutions. In this example the controller application is implemented using JavaScript that runs within the sFlow-RT analytics engine. The script has access to analytics data based on sFlow received from all the switches in the network and can directly access any switch using HTTP to make configuration changes. The script also provides a simple HTTP "Northbound API" that allows orchestration software to enable / disable the control function and manually add and remove controls.
include('extras/aluws.js');

var flowkeys = 'inputifindex,ipsource';
var value = 'frames';
var filter = 'direction=ingress&icmptype=8';
var threshold = 1000;

var metricName = 'ddos';
var controls = {};
var enabled = true;
var blockSeconds = 20;
var ruleid = 0;

var collectorIP = "10.0.0.162";
var collectorPort = 8343;

var agents = {
'10.0.0.234':{user:'admin',password:'password',ports:'1/1-20',sampling:128, polling:20}
}

function initializeAgent(agent) {
var rec = agents[agent];
var server = new ALUServer(agent,rec.user,rec.password);
rec.server = server;

server.login();

// configure sFlow
server.runCmds([
'sflow agent ip ' + agent,
'sflow receiver 1 name InMon address '+collectorIP+' udp-port '+collectorPort,
'sflow sampler 1 port '+rec.ports +' receiver 1 rate '+rec.sampling,
'sflow poller 1 port '+rec.ports +' receiver 1 interval '+rec.polling
]);

// get ifIndex to ifName mapping
var res = server.rest('get','mib','ifXTable',{mibObject0:'ifName'});
var rows = res.result.data.rows;
var ifIndexToName = {};
for(var ifIndex in rows) ifIndexToName[ifIndex] = rows[ifIndex].ifName;

server.logout();

agents[agent].ifIndexToName = ifIndexToName;
}

function block(agent,ip,port) {
if(controls[ip]) return;

var rec = agents[agent];
if(!rec) return;

var name = 'rt' + ruleid++;

rec.server.login();

rec.server.runCmds([
'policy condition '+name+' source ip '+ip,
'policy action '+name+' disposition drop',
'policy rule '+name+' condition '+name+' action '+name,
'qos apply'
]);

rec.server.logout();

controls[ip] = {
name: name,
agent:agent,
action:'block',
time: (new Date()).getTime()
};
}

function allow(ip) {
if(!controls[ip]) return;

var ctl = controls[ip];
var agent = ctl.agent;
var rec = agents[agent];

rec.server.login();

rec.server.runCmds([
'no policy rule '+ctl.name,
'no policy action '+ctl.name,
'no policy condition '+ctl.name,
'qos apply'
]);

rec.server.logout();

delete controls[ip];
}

setEventHandler(function(evt) {
if(!enabled) return;

var agent = evt.agent;
var parts = evt.flowKey.split(',');
var ifindex = parts[0];
var ipsource = parts[1];

var rec = agents[agent];
if(!rec) return;

block(agent,ipsource,rec.ifIndexToName[ifindex]);
}, [metricName]);


setIntervalHandler(function() {
// remove stale controls
var stale = [];
var now = (new Date()).getTime();
var threshMs = 1000 * blockSeconds;
for(var addr in controls) {
if((now - controls[addr].time) > threshMs) stale.push(addr);
}
for(var i = 0; i < stale.length; i++) allow(stale[i]);
},10);


setHttpHandler(function(request) {
var result = {};
try {
var action = '' + request.query.action;
switch(action) {
case 'block':
var agent = request.query.agent[0];
var address = request.query.address[0];
var port = request.query.port[0];
if(agent&&address&&port) block(agent,address,port);
break;
case 'allow':
var address = request.query.address[0];
if(address) allow(address);
break;
case 'enable':
enabled = true;
break;
case 'disable':
enabled = false;
break;
}
}
catch(e) { result.error = e.message }
result.controls = controls;
result.enabled = enabled;
return JSON.stringify(result);
});

setFlow(metricName,{keys:flowkeys,value:value,filter:filter});
setThreshold(metricName,{metric:metricName,value:threshold,byFlow:true,timeout:10});

for(var agent in agents) {
initializeAgent(agent);
}
The following command line argument loads the script on startup:
-D script.file=omniddos.js
Some notes on the script:
  1. The included extras/aluws.js script defines the ALUServer() function which provides access to the OmniSwitch Web Services API
  2. The filter looks for flows of ingress ICMP echo request packets - this is useful for the demo, but in practice filters would be constructed to look for attacks from external sources, targeting internal servers - see Performance aware software defined networking
  3. The controls structure is used to keep track of state associated with deployed configuration changes so that they can be undone
  4. The intervalHandler() function is used to automatically release controls after 20 seconds - the timeout is short for the purposes of demonstration, in practical deployments the timeout would be much measured in hours
  5. The ifIndexToName mapping allows the ifIndex numbers reported by sFlow to be mapped to interface names in CLI commands
  6. Additional switches and settings can be added to agents structure - hundreds of switches can be monitored and controlled by a single sFlow-RT instance.
  7. The block() and allow() commands use filtering policy commands to implement controls that block traffic. The script can easily be modified to implement different policies (for example to rate limit or mark traffic), or in the case of large flood attacks, changing BGP settings to cause the upstream provider to drop traffic (e.g. Hurricane Electric Customer Blackhole Community)
To try out the script, use a web browser to view a trend of traffic and then perform the following steps:
  1. disable the controller (http://10.0.0.162:8008/script/omniddos.js/json?action=disable)
  2. perform a simulated DoS attack (using a flood ping)
  3. enable the controller (http://10.0.0.162:8008/script/omniddos.js/json?action=enable)
  4. simulate a second DoS attack

When the controller is disabled, the simulated attack traffic exceeds 3,000 packets per second and persists until the attacker stops sending. When the controller is enabled, traffic is blocked when it hits the 1,000 packet per second threshold in the application. The control is removed 20 seconds later and re-triggers if the attacker is still sending traffic.
DDoS mitigation is only one use case for large flow control, others described on this blog include: ECMP / LAG load balancing, traffic marking, blacklists, and packet capture. Scripts can be added to address these different use cases, as well as providing information on network health and server performance to operations teams (see Exporting events using syslog and Metric export to Graphite)

Physical switch hybrid OpenFlow example

$
0
0
Alcatel-Lucent OmniSwitch analytics driven control provided an example with a physical switch, using the Web Services API to send CLI controls to the switch as HTTP requests, the following screen shot shows the results:
Figure 1: Controller using HTTP / REST API
Integrated hybrid OpenFlow describes how the combination of normal forwarding combined with OpenFlow for control of large flows provides a scaleable and practical solution for traffic engineering. The article used the Mininet testbed to develop a DDoS mitigation controller consisting of the sFlow-RT real-time analytics engine to detect large flows and the Floodlight OpenFlow controller to push control rules to the software virtual switch in the testbed.
Figure 2: Performance aware software defined networking
The OmniSwitch supports hybrid mode OpenFlow and this article will evaluate the performance of a physical switch hybrid OpenFlow solution using the OmniSwitch. The following results were obtained when repeating the DDoS attack test using Floodlight and OpenFlow as the control mechanism:
Figure 3: OmniSwitch controller using hybrid OpenFlow
Figure 3 shows that implementing traffic controls using OpenFlow is considerably faster than those obtained using the HTTP API shown in Figure 1, cutting the time to implement controls from seconds to milliseconds.
Figure 4:Mininet controller using hybrid OpenFlow
Figure 4 shows that the physical switch results are consistent with those obtained using Mininet, demonstrating the value of network simulation as a way to develop controllers before moving them into production. In fact, the Open vSwitch virtual switch used by Mininet is integrated in the mainstream Linux kernel and is an integral part of many commercial and open source virtualization platforms, including: VMware/Nicira NSX, OpenStack, Xen Cloud Platform, XenServer, and KVM. In these environments virtual machine traffic can be controlled using Open vSwitch.

The following command arguments configure the OmniSwitch to connect to the Floodlight controller running on host 10.0.0.53:
openflow logical-switch ls1 mode api
openflow logical-switch ls1 controller 1.0.0.53:6633
openflow logical-switch ls1 version 1.0
The Floodlight web based user interface can be used to confirm that the switch is connected.
The following sFlow-RT script implements the controller:
include('extras/aluws.js');

var flowkeys = 'inputifindex,ipsource';
var value = 'frames';
var filter = 'direction=ingress&icmptype=8';
var threshold = 1000;

var metricName = 'ddos';
var controls = {};
var enabled = true;
var blockSeconds = 20;

var user = 'admin';
var password = 'password';
var sampling = 128;
var polling = 30;

var collectorIP = "10.0.0.162";
var collectorPort = 6343;

// Floodlight OpenFlow Controller REST API
var floodlight = 'http://10.0.0.53:8080/';
var listswitches = floodlight+'wm/core/controller/switches/json';
var flowpusher = floodlight+'wm/staticflowentrypusher/json';
var clearflows = floodlight+'wm/staticflowentrypusher/clear/all/json';

function clearOpenFlow() {
http(clearflows);
}

function setOpenFlow(spec) {
http(flowpusher, 'post','application/json',JSON.stringify(spec));
}

function deleteOpenFlow(spec) {
http(flowpusher, 'delete','application/json',JSON.stringify(spec));
}

var agents = {};
function discoverAgents() {
var res = http(listswitches);
var dps = JSON.parse(res);
for(var i = 0; i < dps.length; i++) {
var dp = dps[i];
var agent = dp.inetAddress.match(/\/(.*):/)[1];
var ports = dp.ports;
var nameToNumber = {};
var names = [];
// get ifName to OpenFlow port number mapping
// and list of OpenFlow enabled ports
for (var j = 0; j < dp.ports.length; j++) {
var port = dp.ports[j];
var name = port.name.match(/^port (.*)$/)[1];
names.push(name);
nameToNumber[name] = port.portNumber;
}
agents[agent] = {dpid:dp.dpid,names:names,nameToNumber:nameToNumber};
}
}

function initializeAgent(agent) {
var rec = agents[agent];
var server = new ALUServer(agent,user,password);
rec.server = server;

var ports = rec.names.join('');

server.login();

// configure sFlow
server.runCmds([
'sflow agent ip ' + agent,
'sflow receiver 1 name InMon address '+collectorIP+' udp-port '+collectorPort,
'sflow sampler 1 port '+ports+' receiver 1 rate '+sampling,
'sflow poller 1 port '+ports+' receiver 1 interval '+polling
]);

// get ifIndex to ifName mapping
var res = server.rest('get','mib','ifXTable',{mibObject0:'ifName'});
var rows = res.result.data.rows;
var ifIndexToName = {};
for(var ifIndex in rows) ifIndexToName[ifIndex] = rows[ifIndex].ifName;

server.logout();

agents[agent].ifIndexToName = ifIndexToName;
}

function block(agent,ip,port) {
if(controls[ip]) return;

var rec = agents[agent];
if(!rec) return;

var name = 'block-' + ip;
setOpenFlow({name:name,switch:rec.dpid,cookie:0,
priority:500,active:true,
'ether-type':'0x0800','src-ip':ip,
actions:''});

controls[ip] = {
name: name,
agent:agent,
action:'block',
time: (new Date()).getTime()
};
}

function allow(ip) {
if(!controls[ip]) return;

deleteOpenFlow({name:controls[ip].name});

delete controls[ip];
}

setEventHandler(function(evt) {
if(!enabled) return;

var agent = evt.agent;
var parts = evt.flowKey.split(',');
var ifindex = parts[0];
var ipsource = parts[1];

var rec = agents[agent];
if(!rec) return;

block(agent,ipsource,rec.ifIndexToName[ifindex]);
}, [metricName]);


setIntervalHandler(function() {
// remove stale controls
var stale = [];
var now = (new Date()).getTime();
var threshMs = 1000 * blockSeconds;
for(var addr in controls) {
if((now - controls[addr].time) > threshMs) stale.push(addr);
}
for(var i = 0; i < stale.length; i++) allow(stale[i]);
},10);


setHttpHandler(function(request) {
var result = {};
try {
var action = '' + request.query.action;
switch(action) {
case 'block':
var agent = request.query.agent[0];
var address = request.query.address[0];
var port = request.query.port[0];
if(agent&&address&&port) block(agent,address,port);
break;
case 'allow':
var address = request.query.address[0];
if(address) allow(address);
break;
case 'enable':
enabled = true;
break;
case 'disable':
enabled = false;
break;
case 'clearof':
clearOpenFlow();
break;
}
}
catch(e) { result.error = e.message }
result.controls = controls;
result.enabled = enabled;
return JSON.stringify(result);
});

discoverAgents();
for(var agent in agents) {
initializeAgent(agent);
}

setFlow(metricName,{keys:flowkeys,value:value,filter:filter});
setThreshold(metricName,{metric:metricName,value:threshold,byFlow:true,timeout:10});
The following command line argument loads the script on startup:
-D script.file=omniofddos.js
Some notes on the script:
  1. A call to the Floodlight REST API is used to discover the set of switches, their IP addresses and OpenFlow datapath identifiers, ports, port names and OpenFlow port numbers.
  2. The initializeAgent() function uses OmniSwitch Web Services API is used to configure sFlow on the switches and ports that are controllable using OpenFlow/Floodlight.
  3. The script maintains mappings between port names, ifIndex numbers and OpenFlow port numbers so that ifIndex numbers used to identify ports in sFlow can be mapped to the port identifiers used into configuration commands and OpenFlow rules.
DDoS mitigation is only one use case for large flow control, others described on this blog include: ECMP / LAG load balancing, traffic marking, blacklists, and packet capture. Scripts can be added to address these different use cases, as well as providing information on network health and server performance to operations teams (see Exporting events using syslog and Metric export to Graphite)

sFlow leads convergence of multi-vendor application, server, and network performance management

$
0
0
Over the last six months, leading Application Delivery Controller (ADC) vendors F5 and A10 have added support for the sFlow standard to their respective TMOS and ACOS operating systems, making multi-vendor, real-time application layer visibility available in approximately 50% of commercial ADC market.
Figure 1:Best of Velocity 2012, The sFlow Standard
Equally important is the availability of sFlow support in leading open source web servers, load balancers, applications servers, hypervisors and operating systems, including: Apache, NGINX, Tomcat, Java, HAproxy, Hyper-V, Xen, KVM, Linux, Windows, Solaris, FreeBSD and AIX. The combination sFlow in ADCs and the application infrastructure behind them provides comprehensive end to end visibility in multi-tier, scale-out, application architectures.

Figure 1 shows the strategic role that ADCs (load balancers) play in controlling the flow of application requests, regulating admission, filtering, directing loads, and virtualizing services. RESTful control of ADCs combined with real-time visibility provides a powerful capability for flexing resources as demand changes, reducing costs and increasing performance as resources are closely matched to workloads.

What is unusual about diagram is the inclusion of the network. Application architects often give little thought to the network since its complexity is conveniently hidden behind APIs. Unfortunately, it is in the nature of scale-out applications that their performance is tightly coupled to that of the network. In addition, the network is shared between application tiers, allowing performance problems to propagate.
Figure 2:sFlow drivers for growth
Application visibility and control in the ADC space along with near universal support for sFlow among switch vendors along combines with Software Defined Networking (SDN) to transform application performance management by orchestrating all the elements of the data center to deliver a comprehensive performance management solution, what VMware calls the Software Defined Data Center (SDDC), Cisco terms the Application Centric Infrastructure (ACI), and Microsoft refers to as the Cloud OS.
Figure 3: Visibility and the software defined data center
Recent breakthroughs in real-time sFlow analysis incorporated in the sFlow-RT analytics engine delivers comprehensive, timely, and actionable metrics through a programmatic interface. Expect to see this technology incorporated in next generation self optimizing orchestration solutions in 2014.
Performance Aware SDN describes the theory behind analytics driven orchestration. The talk describes how fast controller response, programmatic configuration interfaces such as OpenFlow, and consistent instrumentation of all the elements being orchestrated are pre-requisites for feedback control.
The requirement for complete measurement coverage by next generation orchestration systems will create a strong demand for sFlow instrumented infrastructure since sFlow is the only widely supported multi-vendor standard that spans network, server and application resources and delivers the low latency and scaleability required for adaptive control.

Large flow marking using hybrid OpenFlow

$
0
0
Top of rack switches are in a unique position at the edge of the network to implement traffic engineering controls. Marking large flows describes a use case for dynamically detecting and marking large flows as they enter the network:
Figure 1:Marking large flows
Physical switch hybrid OpenFlow example described how real-time sFlow analytics can be used to trigger OpenFlow controls to block denial of service attacks. This article will describe how the sFlow-RT, Floodlight OpenFlow controller, and Alcatel-Lucent OmniSwitch hybrid OpenFlow SDN controller setup can be programmed to dynamically detect and mark large (Elephant) flows as they enter the network.
Figure 2: Large flow marking controller results
In the experimental setup, a flood ping is used to generate a large flow:
ping -f 10.0.0.238 -s 1400
Figure 2 shows the results, the left half of the chart shows traffic when the controller is disabled and the right half shows traffic when the controller is enabled. The blue line trends the largest unmarked flow seen in the network and the gold line shows the largest marked flow. When controller is disabled, none of the traffic is marked. When the controller is enabled, sFlow-RT detects the large flow within a second and makes a call to Floodlight's Static Flow Pusher API to create a rule that matches the IP source and destination addresses of the large flow with actions to set the IP Type of Service bits and forward the packet using the normal forwarding path. The Floodlight controller pushes an OpenFlow rule to the switch. The upstream is also sending sFlow data to sFlow-RT and so the marked traffic be detected and reported by sFlow-RT, confirming that the control has in fact been implemented.

The controller logic is implemented by the following embedded script running within sFlow-RT:
include('extras/aluws.js');

var flowkeys = 'ipsource,ipdestination';
var value = 'bytes';
var filter = 'direction=ingress';

var trigger = 100000;
var release = 100;

var tos = '0x4';

var metricName = 'mark';
var id = 0;
var controls = {};
var enabled = true;

var user = 'admin';
var password = 'password';
var sampling = 128;
var polling = 30;

var collectorIP = "10.0.0.162";
var collectorPort = 8343;

// Floodlight OpenFlow Controller REST API
var floodlight = 'http://10.0.0.53:8080/';
var listswitches = floodlight+'wm/core/controller/switches/json';
var flowpusher = floodlight+'wm/staticflowentrypusher/json';
var clearflows = floodlight+'wm/staticflowentrypusher/clear/all/json';

function clearOpenFlow() {
http(clearflows);
}

function setOpenFlow(spec) {
http(flowpusher, 'post','application/json',JSON.stringify(spec));
}

function deleteOpenFlow(spec) {
http(flowpusher, 'delete','application/json',JSON.stringify(spec));
}

var agents = {};
function discoverAgents() {
var res = http(listswitches);
var dps = JSON.parse(res);
for(var i = 0; i < dps.length; i++) {
var dp = dps[i];
var agent = dp.inetAddress.match(/\/(.*):/)[1];
var ports = dp.ports;
var nameToNumber = {};
var names = [];
// get ifName to OpenFlow port number mapping
// and list of OpenFlow enabled ports
for (var j = 0; j < dp.ports.length; j++) {
var port = dp.ports[j];
var name = port.name.match(/^port (.*)$/)[1];
names.push(name);
nameToNumber[name] = port.portNumber;
}
agents[agent] = {dpid:dp.dpid,names:names,nameToNumber:nameToNumber};
}
}

function initializeAgent(agent) {
var rec = agents[agent];
var server = new ALUServer(agent,user,password);
rec.server = server;

var ports = rec.names.join('');

server.login();

// configure sFlow
server.runCmds([
'sflow agent ip ' + agent,
'sflow receiver 1 name InMon address '+collectorIP+' udp-port '+collectorPort,
'sflow sampler 1 port '+ports+' receiver 1 rate '+sampling,
'sflow poller 1 port '+ports+' receiver 1 interval '+polling
]);

// get ifIndex to ifName mapping
var res = server.rest('get','mib','ifXTable',{mibObject0:'ifName'});
var rows = res.result.data.rows;
var ifIndexToName = {};
for(var ifIndex in rows) ifIndexToName[ifIndex] = rows[ifIndex].ifName;

server.logout();

agents[agent].ifIndexToName = ifIndexToName;
}

function mark(agent,dataSource,flowkey) {
if(controls[flowkey]) return;

var rec = agents[agent];
if(!rec) return;

var name = 'ctl' + id++;
var parts = flowkey.split(',');
setOpenFlow({name:name,switch:rec.dpid,cookie:0,
priority:500,active:true,
'ether-type':'0x0800','src-ip':parts[0],'dst-ip':parts[1],
actions:'set-tos-bits='+tos+',output=normal'});

controls[flowkey] = {
name: name,
agent:agent,
dataSource:dataSource,
action:'mark',
time: (new Date()).getTime()
};
}

function unmark(flowkey) {
if(!controls[flowkey]) return;

deleteOpenFlow({name:controls[flowkey].name});
delete controls[flowkey];
}

setEventHandler(function(evt) {
if(!enabled) return;

mark(evt.agent,evt.dataSource,evt.flowKey);
}, [metricName]);


setIntervalHandler(function() {
// remove controls when flow below release threshold
var stale = [];
for(var flowkey in controls) {
var ctl = controls[flowkey];
var val = flowvalue(ctl.agent,ctl.dataSource+'.'+metricName,flowkey);
if(!val || val <= release) stale.push(flowkey);
}
for(var i = 0; i < stale.length; i++) unmark(stale[i]);
},5);


setHttpHandler(function(request) {
var result = {};
try {
var action = '' + request.query.action;
switch(action) {
case 'enable':
enabled = true;
break;
case 'disable':
enabled = false;
break;
case 'clear':
clearOpenFlow();
controls = {};
break;
}
}
catch(e) { result.error = e.message }
result.controls = controls;
result.enabled = enabled;
return JSON.stringify(result);
});

discoverAgents();
for(var agent in agents) {
initializeAgent(agent);
}

setFlow(metricName,{keys:flowkeys,value:value,filter:filter});
setThreshold(metricName,{metric:metricName,value:trigger,byFlow:true,timeout:10});
The following command line argument loads the script on startup:
-D script.file=omniofmark.js
Some notes on the script:
  1. A call to the Floodlight REST API is used to discover the set of switches, their IP addresses and OpenFlow datapath identifiers, ports, port names and OpenFlow port numbers.
  2. The initializeAgent() function uses OmniSwitch Web Services API is used to configure sFlow on the switches and ports that are controllable using OpenFlow/Floodlight.
  3. A threshold is set to trigger an event when a flow exceeds 100,000 bytes/second
  4. The eventHandler() is triggered when large flows are detected and it calls the mark() function to push a control to Floodlight.
  5. The mark() function extracts source and destination IP address information from the flowkey and constructs a Static Flow Pusher message that matches the flow. The key to making this example work is a switch that is able to implement the actions set-tos-bits=0x4,output=normal  These actions instruct the switch to mark the traffic by setting the IP TOS bits and then use the normal hardware forwarding path.
  6. The intervalHander() function runs every 5 seconds and checks the traffic levels of each of the large flows that are being controlled. If the flow is no longer detectable or below the release threshold  of 100 bytes/second then Floodlight is instructed to remove the rule, freeing up hardware resources for new large flows.
Large flow marking is only one use case for large flow control, others described on this blog include: DDoS mitigation, ECMP / LAG load balancing, blacklists, and packet capture. Scripts can be added to address these different use cases, as well as providing information on network health and server performance to operations teams (see Exporting events using syslog and Metric export to Graphite)

Flow-aware Real-time SDN Analytics (FRSA)

$
0
0
Today at the OpenDaylight Summit in Santa Clara, Ram (Ramki) Krishnan of Brocade Communications presented a framework and set of use cases for applying software defined networking (SDN) techniques control large (elephant) flows. Ramki is a co-author of related Internet Drafts: Large Flow Use Cases for I2RS PBR and QoS and Mechanisms for Optimal LAG/ECMP Component Link Utilization in Networks. The slides from the talk are available on the OpenDaylight Summit web site.

This article will review the slides and discuss selected topics in detail.
The FRSA framework identifies four classes of traffic flow based on flow rate and flow duration and identifies long lived large flows as amenable to SDN based control since they can be readily observed, consume significant resources, and last long enough to be effectively controlled. The article, SDN and large flows, discusses the opportunity presented by large flow control in greater detail.
The two elements required in the FRSA framework are real-time traffic analytics - to rapidly identify the large flows (within seconds) and a control mechanism such as integrated hybrid OpenFlow, that allows the normal switch forwarding protocols to handle traffic, but offers a way for the controller to intervene and determine the treatment of large flows.
The first use case described is distributed denial of service (DDoS) mitigation. The slide describes current approaches where a DDoS Appliance is added to the network to detect and filter attack traffic. However, large flood attacks aimed at overwhelming the Internet connection (the link between the Router and the Internet cloud in the diagram) cannot be mitigated using on site resources - they must be handled upstream.
DDoS mitigation is a large and growing problem and the market for DDoS mitigation appliances is significant and growing market, DDoS prevention market to grow by double digits through 2014 and Denial of Service Attacks Surge and Expose Enterprise Infrastructure Vulnerabilities and New Needs, IDC Says. There is an opportunity for service providers to capture a share of this market if they can use SDN to monitor and control their existing network infrastructure and deliver DDoS mitigation as a service to protect their customer's Internet connection from flood attacks. By removing the large flood attacks, existing ADC / load balancers / firewalls can be used to mitigate lower volume application layer attacks.
The following slide details the elements of the SDN DDoS mitigation solution:
This diagram shows how standard sFlow enabled in the switches and routers provides a constant stream of measurement data to an External Collector (sFlow-RT), which notifies the DDoS SDN application when large DDoS flows are detected. The DDoS SDN application selects a mitigation action and instructs the SDN Controller (OpenDaylight) to push the action to selected switches (for example using an OpenFlow rule to drop traffic associated with the DDoS attack). An example of this technique is described in detail in Physical switch hybrid OpenFlow example - demonstrating that the entire detection and mitigation cycle within 1 to 2 seconds.
The second use case is to load balance large flows in link aggregation (LAG) groups. The hash function used to spread traffic on a LAG group works for small flows, but large flows can end up on a single LAG member, limiting throughput even though there is spare capacity on other members of the group, see Load balancing LAG/ECMP groups.
The Large Flow LAG load balancing SDN application again makes use of real-time sFlow based analytics to rapidly detect large flows and the SDN Controller to selectively override forwarding decisions in Router 1 in order to load balance the flows across the link group connecting it to Router 2.
The third use case is similar to LAG load balancing. Equal cost multi-path (ECMP) routing is uses to spread traffic across a leaf and spine network topology. Again, hash based load balancing can result in large flow collisions and sub-optimal throughput.
The Large Flow Global load balancing SDN application makes use of centralized real-time analytics to identify flow collisions anywhere in the fabric and then instructs the SDN Controller to override forwarding in selected switches in order to shift flows to links with spare capacity, see ECMP load balancing.

The next three slides from the talk describe deployment opportunities for SDN based large flow load balancing.
The combination of sFlow analytics with integrated Hybrid OpenFlow described in the FRSA framework is a pragmatic approach to addressing the challenges of DDoS mitigation and load balancing in large scale, high speed network environments. The hybrid approach leverages the capabilities of existing distributed control planes to efficiently load balance small flows and combines it with an SDN controller to manage the relatively small number of large long lived flows that dominate network usage.

The key to making this approach work is pervasive support for the sFlow standard among switch vendors and recent breakthroughs in real-time sFlow analytics (sFlow-RT) that together deliver the scaleable data center wide monitoring and real-time detection of large flows needed to drive SDN applications.

It's exciting to see SDN solutions maturing and major networking vendors describing practical SDN solutions that address pressing challenges that can realistically be deployed in production networks in the near term. It looks like this is the year that SDN will emerge from proof of concept to deployment in commercially viable solutions.

#NFD7 Real Time SDN and NFV Analytics for DDoS Mitigation

$
0
0

Today, at Networking Field Day 7, Ramki Krishnan of Brocade Networks demonstrated how the sFlow and OpenFlow standards can be combined to deliver DDoS mitigation as a service. Ramki is a co-author of related Internet Drafts: Large Flow Use Cases for I2RS PBR and QoS and Mechanisms for Optimal LAG/ECMP Component Link Utilization in Networks.
The talk starts by outlining the growing problem of DDoS attacks and the market opportunity for mitigation solutions, referencing the articles, Prolexic Publishes Top 10 DDoS Attack Trends for 2013, World's largest DDoS strikes US, Europe.
The diagram shows the unique position occupied by Internet Service Provider (ISP) and Internet Exchange (IX) networks, allowing them to filter large flood attacks and prevent them from overwhelming Enterprise customer connections - provided they can use their network to efficiently detect attacks and automatically filter traffic for their customers.
This diagram shows how standard sFlow enabled in the switches and routers provides a continuous stream of measurement data to InMon sFlow-RT, which provided real-time detection and notification of DDoS attacks to the DDoS Mitigation SDN Application. The DDoS Mitigation SDN Application selects a mitigation action and instructs the SDN Controller to push the action to selected switches (for example using a standard OpenFlow rules to drop traffic associated with the DDoS attack).

The key making this solution scale is the use of hybrid port OpenFlow. By default, all traffic is handled by the switch's normal hardware switching and routing function without any intervention from the controller. The OpenFlow rules are used to override the normal forwarding behavior for the selected flow. The solution uses a software controller to leverages the standard sFlow and OpenFlow capabilities of existing network hardware to provide a scaleable, automated, cost effective solution that allows ISP/IX networks to effectively mitigate flood attacks.
The live demo shows a continuous stream of NTP reflection attacks created by a traffic generator, each attack lasting 20 seconds. The chart at the top right shows the attack traffic in red and the normal traffic in green. The Brocade MLXe switch sends a continuous stream of sFlow measurements to InMon's sFlow-RT analytics engine.

The sFlow-RT software performs a number of functions:
  1. Provides a REST API allowing the customer to set thresholds and mitigation policies
  2. Detects the DDoS attack
  3. Extracts attributes that characterize the attack traffic - UDP source port (123) and destination IP address (12.12.1.2) in this example
  4. Constructs a filter to drop the attack
  5. Makes a call to OpenDaylight's Flow Programmer REST API to instruct OpenDaylight to send the filter as an OpenFlow rule the MLXe
  6. Continues to monitor the DDoS traffic
  7. Makes a call to OpenDaylight to remove the rule once the attack subsides
  8. Provides statistics to drive the demo dashboard - which in a real deployment would be the customer portal
The chart at the bottom right of the screen shows the traffic after it has been filtered by the controller. As each new attack is launched, it is immediately detected and removed so that the link is protected and the normal traffic gets to the customer network. While the demonstration shows one switch and one protected 10Gigabit link, the solution easily scales to hundreds of switches, tens of thousands links and 100Gigabit link speeds.

This demonstration of DDoS mitigation is only one application of this architecture - Ramki's OpenDaylight Summit talk Flow-aware Real-time SDN Analytics (FRSA)  presented a number of others.

Dell, Cumulus, Open Source, Open Standards, and Unified Management

$
0
0

On Thursday, at Network Field Day 7, Arpit Joshipura described Dell's networking strategy. He started by polling the delegates to see which topics were most on their mind.
The first topic raised by many of the delegates was the recently announced Dell/Cumulus partnership (listed as Open NW on the white board), see Dell Unlocks New Era for Open Networking, Decouples Hardware and Software. Next on the list was an interest in Dell's Open Source networking strategy, understanding Dell's Differentiation strategy, and plans for L3.
Dell's open networking strategy is described at time marker 14:55 in the video. Dell was one of the first vendors to move to merchant silicon, now they are opening up the switch platform, allowing customers to choose from standard merchant silicon based switch platforms (Broadcom, Intel) and switch software (currently FTOS / Cumulus).

Arpit suggests that customers will choose Cumulus Linux as the operating system for the layer 3 features and because they can use the same expertise and tools (Puppet, Chef etc.) to manage Linux servers and the switches connecting them. He also suggested that customers would choose FTOS for legacy networks and layer 2 features. Support for the Open Networking Install Environment (ONIE) allows customers to load different switch operating systems on the hardware. This is the same model as Dell uses when selling servers, allowing customers to choose hardware (Intel/AMD), software (Windows, SUSE, Red Hat), and obtain support from Dell. Arpit summarizes the strategy, "Michael Dell did this on PCs, he did it on servers and I think we are in the best position to do it for networking."
The recent talk, It Ain't Software Defined until you Unbundle the Platform, by JR Rivers Co-Founder/CEO of Cumulus Networks, at the Silicon Valley Software Defined Networking Group captures the vision. While the number of hardware and software choices is currently limited, both the Dell and Cumulus talks are clear that Cumulus Linux is the first of many software choices, other likely future candidates include: Broadcom Fastpath, Big Switch's Switch Light Linux, Pluribus OpenNetvisor, Pica8 PicOS, etc. On the hardware front, expect a greater variety of switching platforms, ranging from familiar top of rack configurations to others that look more like servers with the CPU and memory resources to implement application functions like content distribution, caching, load balancing etc.

Open switching platforms and merchant silicon are part of a set of accelerating trends that are driving toward a common set of standards and APIs that deliver the data center wide visibility and control needed to deliver agile, self optimizing, software defined data centers - see Drivers for growth.

ONS2014 Announces Finalists for SDN Idol 2014

$
0
0
Today the Open Networking Summit announced the five finalists for the SDN Idol 2014 competition:
Real-time SDN Analytics for DDoS mitigation is an example of a performance aware SDN controller that combines sFlow and OpenFlow for the visibility and control needed to build self optimizing networks that automatically adapt to changing traffic conditions. A number of other use cases were outlined by Brocade at the recent OpenDaylight Summit - see Flow-aware Real-time SDN Analytics (FRSA)

There are interesting links with other finalists:
  • OpenDaylight Hydrogen The Brocade is a Platinum member of the OpenDaylight project, and the Brocade/InMon DDoS mitigation solution employs OpenDaylight Hydrogen as an OpenFlow controller. Like Brocade, many of the OpenDaylight project members also support sFlow in their networking equipment, including: Brocade, Cisco, IBM, Juniper, NEC, A10 Networks, Arista, Dell, HP, Huawei, Intel, and ZTE. One might expect to see other vendors start to build traffic aware solutions on OpenDaylight in the coming months.
  • HP SDN App Store and Open SDN Ecosystem Every OpenFlow enabled switch in HP's SDN Ecosystem supports the sFlow standard. Future versions of HP's SDN controller could leverage the sFlow capabilities of HP switches to deliver network visibility, allowing the controller platform to support scaleable performance aware SDN applications.
  • Pica8 Open SDN Starter Kit The switch contained in the starter kit supports sFlow, making the starter kit a great way to experiment with combined sFlow and OpenFlow solutions. There are a number of examples on this blog that could be tried with the starter kit - see OpenFlow.
The five finalists cover a broad spectrum of SDN solutions - it will be interesting to see them demonstrated live at the Open Networking Summit on Monday, March 3, 02:30P - 04:00P

ONS2014 SDN Idol finalist demonstrations

$
0
0

The video of the ONS 2014 SDN Idol final demonstrations has been released (the demonstrations were presented live at the Open Networking Summit on Monday, March 3, 02:30P - 04:00P).

The first demo presented is Real-time SDN Analytics for DDoS mitigation, a joint Brocade / InMon solution that combines real-time sFlow analytics and OpenFlow with SDN so that service providers can deliver large scale distributed denial of service (DDoS) attack mitigation services to their enterprise customers using their existing network infrastructure. DDoS mitigation is particularly topical, two weeks ago, a large attack was targeted at CloudFlare, DDoS Attack Hits 400 Gbit/s, Breaks Record, and this past week, Meetup.com has been hit with a large persistent attack, Meetup Suffering Significant DDoS Attack, Taking It Offline For Days. The SDN DDoS mitigation solution can address these large attacks by leveraging the multi-Terabit, line-rate, monitoring and filtering capabilities in the network switches.
ONS2014 Announces Finalists for SDN Idol 2014 provides some sFlow related trivia relating to the finalists. 
An expert panel of judges selected the finalists:

The finalists were selected based on the following criteria:
Voting is open to ONS delegates and will occur during this evenings reception and the winner will be announced tomorrow.

Performance optimizing hybrid OpenFlow controller

$
0
0
The latest release of InMon's sFlow-RT controller adds integrated hybrid OpenFlow support - optimized for real-time traffic engineering applications that manage large traffic flows, including: DDoS mitigation, ECMP load balancing, LAG load balancing, large flow marking etc.

This article discusses the evolving architecture of software defined networking (SDN) and the role of analytics and traffic engineering. InMon's sFlow-RT controller is used to provide practical examples of the architecture.
Figure 1: Fabric: A Retrospective on Evolving SDN
The article, Fabric: A Retrospective on Evolving SDN by Martin Casado, Teemu Koponen, Scott Shenker, and Amin Tootoonchian, makes the case for a two tier software defined networking (SDN) architecture; comprising a smart edge and an efficient core. The article, Pragmatic software defined networking on this blog, examines how the edge is moving into virtual switches, with tunneling (VxLAN, NVGRE, GRE, STT) used to virtualize the network and decouple the edge from the core. As complex policy decisions move to the network edge, the core fabric is left with the task of efficiently managing physical resources in order to deliver low latency, high bandwidth connectivity between edge switches.

First generation SDN controllers were designed before the edge / core split became apparent and contain a complex set of features that limit their performance and scaleability. The sFlow-RT controller represents a second generation design, targeted specifically at the challenge of optimizing the performance of the physical network fabric.

Equal cost multi-path routing (ECMP), link aggregation (LAG) and multi-chassis link aggregation (MLAG) provide methods for spreading traffic across multiple paths in data center network fabrics in order to deliver the bandwidth needed to support big data and cloud workloads. However, these methods of load balancing do not handle all types of traffic well - in particular, long duration, high bandwidth "elephant" flows - see Of Mice and Elephants by Martin Casado and Justin Pettit with input from Bruce Davie, Teemu Koponen, Brad Hedlund, Scott Lowe, and T. Sridhar. The article SDN and large flows on this blog reviews traffic studies and discusses the benefits of actively managing large flows using an SDN controller.

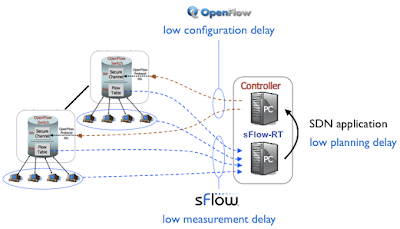
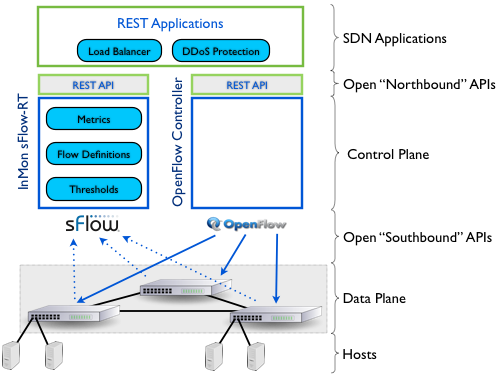
The sFlow-RT controller makes use of two critical technologies that allow it to actively manage large flows in large scale production networks:
  1. sFlow - The sFlow standard is widely supported by data center switch vendors and merchant silicon and provides the scaleability and rapid detection of large flows needed for effective real-time control.
  2. Integrated hybrid OpenFlow - With integrated hybrid OpenFlow, the normal forwarding mechanisms in switches are the default for handling traffic (ECMP, LAG, MLAG), i.e. packets are never sent to the controller to make forwarding decisions. OpenFlow is used to selectively override default forwarding in order to improve performance. This approach is extremely scaleable and robust - there is minimal overhead associated with maintaining the OpenFlow connections between the controller and the switches, and the network will still continue to forward traffic if the controller fails. 
A demonstration using an older version of sFlow-RT with an embedded JavaScript DDoS mitigation application and an external OpenFlow controller (Open Daylight) won the SDN Idol competition at the 2014 Open Networking Summit - see Real-time SDN Analytics for DDoS mitigation for a video of the live demonstration and details of the competition.
Much of the complexity in developing SDN control applications involves sharing and distributing state between the analytics engine, application, and OpenFlow controller. Modifying the DDoS mitigation scripts presented on this blog to use sFlow-RT's embedded OpenFlow controller is straightforward and delivers the performance, scaleability and robustness needed to move the DDoS mitigation applications into production.
However, in this article, the interesting problem of detecting and marking elephant flows described in Of Mice and Elephants and Marking large flows will be used to demonstrate the sFlow-RT controller. Before looking at how sFlow-RT handles large flow marking, it is worth looking at existing approaches. The article, Elephant Flow Mitigation via Virtual-Physical Communication, on VMware's Network Virtualization blog describes how Open vSwitch was modified to include an "NSX Elephant agent" to detect large flows. When a large flow is detected, a notification is sent to the HP VAN SDN Controller that is running a special application that responds to the large flow notifications. The industry’s first east-west federated solution on HP's Networking blog further describes the solution, providing a demonstration in which large flows are given a different priority marking to small flows.

In contrast, the following sFlow-RT controller JavaScript application implements large flow marking:
// Define large flow as greater than 100Mbits/sec for 0.2 seconds or longer
var bytes_per_second = 100000000/8;
var duration_seconds = 0.2;

var idx = 0;

setFlow('tcp',
{keys:'ipsource,ipdestination,tcpsourceport,tcpdestinationport',
value:'bytes', filter:'direction=ingress', t:duration_seconds}
);

setThreshold('elephant',
{metric:'tcp', value:bytes_per_second, byFlow:true, timeout:2,
filter:{ifspeed:[1000000000]}}
);

setEventHandler(function(evt) {
var agent = evt.agent;
var ports = ofInterfaceToPort(agent);
if(ports && ports.length == 1) {
var dpid = ports[0].dpid;
var id = "mark" + idx++;
var k = evt.flowKey.split(',');
var rule= {
priority:500, idleTimeout:2,
match:{dl_type:2048, nw_proto:6, nw_src:k[0], nw_dst:k[1],
tp_src:k[2], tp_dst:k[3]},
actions:["set_nw_tos=128","output=normal"]
};
setOfRule(dpid,id,rule);
}
},['elephant']);
The following command line arguments load the script and enable OpenFlow on startup:
-Dscript.file=ofmark.js -Dopenflow.controller.start=yes
Some notes on the script:
  1. The 100Mbits/s threshold for large flows was selected because it represents 10% of the bandwidth of the 1Gigabit access ports on the network
  2. The setFlow filter specifies ingress flows since the goal is to mark flows as they enter the network
  3. The setThreshold filter specifies that thresholds are only applied to 1Gigabit access ports
  4. The OpenFlow rule generated in setEventHandler exactly matches the addresses and ports in each TCP connection and includes an idleTimeout of 2 seconds. This means that OpenFlow rules are automatically removed by the switch when the flow becomes idle without any further intervention from the controller.
The iperf tool can be used to generate a sequence of large flows to test the controller:
while true; do iperf -c 10.100.10.152 -i 20 -t 20; sleep 20; done
The following screen capture shows a basic test setup and results:
The screen capture shows a mixture of small flows "mice" and large flows "elephants" generated by a server connected to an edge switch (in this case an Alcatel-Lucent OmniSwitch 6900). The graph at the bottom right shows the mixture of unmarked traffic being sent to the switch. The sFlow-RT controller receives a stream of sFlow measurements from the switch and detects each elephant flows in real-time, immediately installing an OpenFlow rule that matches the flow and instructing the switch to mark the flow by setting the IP type of service bits. The traffic upstream of the switch is shown in the top right chart and it can be clearly seen that each elephant flow has been identified and marked, while the mice have been left unmarked.
Note: While this demonstration only used a single switch, the solution easily scales to hundreds of switches and thousands of edge ports.
The sFlow-RT large flow marking application is a much simpler than the large flow marking solution demonstrated by HP and VWware - which requires special purpose instrumentation embedded in a customized virtual switch and complex inter-controller communication. In contrast, the sFlow-RT controller leverages standard sFlow instrumentation built into commodity network devices to detect large flows in real time. Over 40 network vendors support the sFlow standard, including most of the NSX network gateway services partners and the HP 5930AF used in the HP / VMware demo. In addition, sFlow is widely available in virtual switches, including: Open vSwitch, Hyper-V Virtual Switch, IBM Distributed Virtual Switch 5000v, and HP FlexFabric Virtual Switch 5900v.

While it is possible to mark large flows based on a simple notification - as was demonstrated by HP/VMware - load balancing requires complete visibility into all links in the fabric. Using sFlow instrumentation embedded in the network devices, sFlow-RT has the real-time view of the utilization on all links and the information on all large flows and the their paths across the fabric needed for load balancing.
Why sFlow? What about other measurement protocols like Cisco NetFlow, IPFIX, SNMP, or using OpenFlow counters? The sFlow standard is uniquely suited to real-time traffic engineering because it provides the low latency, scaleability, and flexibility needed to support SDN traffic engineering applications. For a detailed discussion of the requirements for analytics driven control, see Performance Aware SDN.
Basing the sFlow-RT fabric controller on widely supported sFlow and OpenFlow standards and including an open, standards based, programming environment (JavaScript / ECMAScript) makes sFlow-RT an ideal platform for rapidly developing and deploying traffic engineering SDN applications in existing networks.
Viewing all 353 articles
Browse latest View live


Latest Images