Quantcast
Channel: sFlow
Viewing all 347 articles
Browse latest View live

CloudFlare DDoS Mitigation Pipeline

$
0
0
The Usenix Enigma 2016 talk from Marek Majkowski describes CloudFlare's automated DDoS mitigation solution. CloudFlare provides reverse proxy services for millions of web sites and their customers are frequently targets of DDoS attacks. The talk is well worth watching in its entirety to learn about their experiences.
Network switches stream standard sFlow data to CloudFlare's "Gatebot" Reactive Automation component, which analyzes the data to identify attack vectors. Berkeley Packet Filter (BPF) rules are constructed to target specific attacks and apply customer specific mitigation policies. The rules are automatically installed in iptables firewalls on the CloudFlare servers.
The chart shows that over a three month period CloudFlare's mitigation system handled between 30 and 300 attacks per day.
Attack volumes mitigated regularly hit 100 million packers per second and reach peaks of over 150 million packets per second. These large attacks can cause significant damage and automated mitigation is critical to reducing their impact.

Elements of the CloudFlare solution are readily accessible to anyone interested in building DDoS mitigation solutions. Industry standard sFlow instrumentation is widely supported by switch vendors. Download sFlow-RT analytics software and combine real-time DDoS detection with business policies to automate mitigation actions. A number of DDoS mitigation examples are described on this blog that provide useful starting point for implementing an automated DDoS mitigation solution.

Linux bridge, macvlan, ipvlan, adapters

$
0
0
The open source Host sFlow project added a feature to efficiently monitor traffic on Linux host network interfaces: network adapters, Linux bridge, macvlan, ipvlan, etc. Implementation of high performance sFlow traffic monitoring is made possible by the inclusion of random packet sampling support in the Berkeley Packet Filter (BPF) implementation in recent Linux kernels (3.19 or later).

In addition to the new BPF capability, hsflowd has a couple of other ways to monitor traffic:
  • iptables, add a statistic rule to the iptables firewall to add traffic monitoring
  • Open vSwitch, has built-in sFlow instrumentation that can be configured by hsflowd.
The BPF sampling mechanism is less complex to configure than iptables and can be used to monitor any Linux network device, including: network adapters (e.g. eth0) and the Linux bridge (e.g. docker0). Monitoring a network adapter also provides visibility into lightweight macvlan and ipvlan network virtualization technologies that are likely to become more prevalent in the Linux container ecosystem, see Using Docker with macvlan Interfaces.

The following commands build and install hsflowd on an Ubuntu 14.03 host:
sudo apt-get update
sudo apt-get install build-essential
sudo apt-get install libpcap-dev
sudo apt-get install git
git clone https://github.com/sflow/host-sflow
cd host-sflow
make
sudo make install
Installing Host sFlow on a Linux server provides basic instructions for configuring the Host sFlow agent (hsflowd). To monitor traffic on the host, edit the /etc/hsflowd.conf file configure the sFlow collector and enable packet sampling on eth0
pcap { dev = eth0 }
Now start the daemon:
sudo hsflowd start
At this point packet traversing eth0 will be sampled and sent out as part of the standard sFlow telemetry stream sent to an sFlow analyzer. For example, using sFlow-RT with the top-flows application as the sFlow analyzer generated the top flows table below.
There a numerous server monitoring agents available in the open source community that will export similar host statistics (CPU, memory, disk) to the Host sFlow agent. Host sFlow differs by also including network traffic visibility using the same packet sampling mechanism supported by most data center switches. Significant advances are extending the visibility into the physical network, for example, Broadcom BroadView Instrumentation tracks buffer utilization and microbursts that effect application performance.
A common standard for monitoring physical and virtual network and server infrastructure reduces operational complexity. Visibility into network activity is critical to understanding the performance of scale out applications that drive large amounts of East-West traffic. Host sFlow, along with support for sFlow in the physical network, delivers scaleable data center wide telemetry to SDN and DevOps tools so that they can better orchestrate the allocation of resources to maximize performance and reduce costs.

Open vSwitch version 2.5 released

$
0
0
The recent Open vSwitch version 2.5 release includes significant network virtualization enhancements:
   - sFlow agent now reports tunnel and MPLS structures.
...
- Add experimental version of OVN. OVN, the Open Virtual Network, is a
system to support virtual network abstraction. OVN complements the
existing capabilities of OVS to add native support for virtual network
abstractions, such as virtual L2 and L3 overlays and security groups.
The sFlow Tunnel Structures specification enhances visibility into network virtualization by capturing encapsulation / decapsulation actions performed by tunnel end points. In many network virtualization implementations VXLAN, GRE, Geneve tunnels are terminate in Open vSwitch and so the new feature has broad application.

The second related feature is the inclusion of the Open Virtual Network (OVN), providing a simple method of building virtual networks for OpenStack and Docker.

The following articles provide additional background:

Microservices

$
0
0
Figure 1:Visibility and the software defined data center
In the land of microservices, the network is the king(maker) by Sudip Chakrabarti, Lightspeed Venture Partners, makes the case that visibility into network traffic is the key to monitoring, managing and securing applications that are composed of large numbers of communicating services running in virtual machines or containers.
While I genuinely believe that the network will play an immensely strategic role in the microservices world, inspecting and storing billions of API calls on a daily basis will require significant computing and storage resources. In addition, deep packet inspection could be challenging at line rates; so, sampling, at the expense of full visibility, might be an alternative. Finally, network traffic analysis must be combined with service-level telemetry data (that we already collect today) in order to get a comprehensive and in-depth picture of the distributed application.
Sampling isn't just an alternative, sampling is the key to making large scale microservice visibility a reality. Shrink ray describes how sampling acts as a scaling function, reducing the task of monitoring large scale microservice infrastructure from an intractable measurement and big data problem to a lightweight real-time data center wide visibility solution for monitoring, managing, optimizing and securing the infrastructure.
Figure 2:sFlow Host Structures
Industry standard sFlow is the multi-vendor method for distributed sampling of network traffic. The sFlow standard is model based - models of entities such as interfaces, switches, routers, forwarding state, hosts, virtual machines, messages, etc. are used to define standard measurements that describe their operation. Standardized measurements embedded within the infrastructure ensure consistent reporting that is independent of the specific vendors and application stacks deployed in the data center. Push vs Pull describes how sFlow's push based streaming telemetry addresses the challenge of monitoring large scale cloud environments where services and hosts are constantly being added, removed, started and stopped. In addition, sFlow Host Structures describes how the data model allows telemetry streams from independent sources in network, server and application entities to be combined at the sFlow receiver to provide end to end visibility into the microservice interactions and the compute and networking services on which they depend.

The challenge in delivering network visibility to microservice management tools is not technical - the solution is fully deployable today:
  • Applications - e.g. Apache, NGINX, Tomcat, HAproxy, ADC (F5, A10, ..), Memcache, ...
  • Virtual Servers - e.g. Xen, Hyper-V, KVM, Docker, JVM, ...
  • Virtual Network - e.g. Open vSwitch, Linux Bridge, macvlan, ...
  • Servers - e.g. Linux, Windows, FreeBSD, Solaris, AIX
  • Network - e.g. Cisco Nexus 9k/3k, Arista, Juniper QFX/EX, Dell, HPE, Brocade, Cumulus, Big Switch, Pica8, Quanta, ... – visit sFlow.org for a complete list
Network, system and application teams working together can enable sFlow instrumentation that is already embedded throughout the infrastructure to achieve comprehensive visibility into microservice interactions.
Incorporating sFlow analytics into the microservices architecture is straightforward. The sFlow-RT analytics engine processes the raw telemetry streams, combines data using the data model, and delivers visibility as a REST based microservice that is easily consumed by new and existing cloud based or locally hosted orchestration, operations, and security tools.

Network and system analytics as a Docker microservice

$
0
0
Microservices describes why the industry standard sFlow instrumentation embedded within cloud infrastructure is uniquely able to provide visibility into microservice deployments.

The sFlow-RT analytics engine is well suited to deployment as a Docker microservice since the application is stateless and presents network and system analytics as a RESTful service.

The following steps demonstrate how to create a containerized deployment of sFlow-RT.

First, create a directory for the project and edit the Dockerfile:
mkdir sflow-rt
cd sflow-rt
vi Dockerfile
Add the following contents to Dockerfile:
FROM   centos:centos6
RUN yum install -y java-1.7.0-openjdk
RUN rpm -i http://www.inmon.com/products/sFlow-RT/sflow-rt-2.0-1072.noarch.rpm
EXPOSE 8008 6343/udp
CMD /etc/init.d/sflow-rt start && tail -f /dev/null
Build the project:
build -t sflow-rt .
Run the service:
docker run -p 8008:8008 -p 6343:6343/udp -d sflow-rt
Access the API at http://docker_host:8008/ to verify that the service is running.

Now configure sFlow agents to send data to the docker_host on port 6343:
The following articles provide examples of using the sFlow-RT REST API:
The diagram shows how new and existing cloud based or locally hosted orchestration, operations, and security tools can leverage sFlow-RT's analytics service to gain real-time visibility. The solution is extremely scaleable, a single sFlow-RT instance can monitor thousands of servers and the network devices connecting them.

Internet Exchange (IX) Metrics

$
0
0
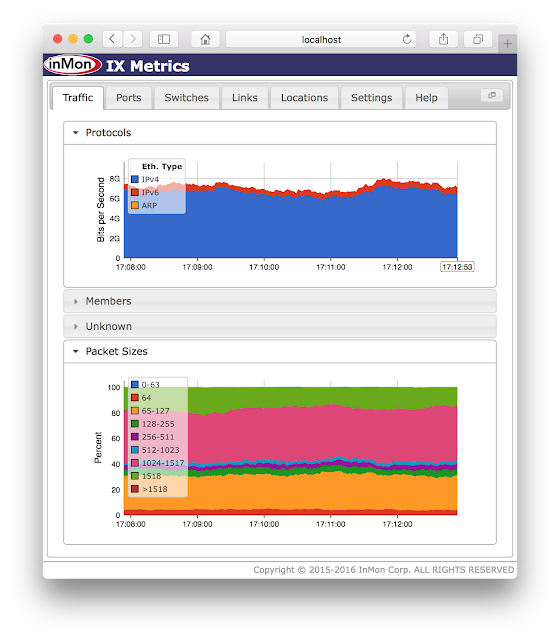
IX Metrics has been released on GitHub, https://github.com/sflow-rt/ix-metrics. The application provides real-time monitoring of traffic between members in an Internet Exchange (IX).

Close monitoring of exchange traffic is critical to operations:
  1. Ensure that there is sufficient capacity to accommodate new and existing members.
  2. Ensure that all traffic sources are accounted for and that there are no unauthorized connections.
  3. Ensure that only allowed traffic types are present.
  4. Ensure that non-unicast traffic is strictly controlled.
  5. Ensure that packet size policies are controlled to avoid loss due to MTU mismatches.
IX Metrics imports information about exchange members using the IX Member List JSON Schema. The member information is used to create traffic analytics and traffic is checked against the schema to identify errors, for example, if a member is using a MAC address that isn't listed.

The measurements from the exchange infrastructure are useful to members since it allows them to easily see how much traffic they are exchanging with other members through their peering relationships. This information is easy to collect using the exchange infrastructure, but much harder for members to determine independently.

The sFlow standard has long been a popular method of monitoring exchanges for a number of reasons:
  1. sFlow instrumentation is built into high capacity data center switches used in exchanges.
  2. Exchanges handle large amounts of traffic, many Terabits/second in large exchanges and sFlow instrumentation has the scaleability to monitor the entire infrastructure.
  3. Exchanges typically operate at layer 2 (i.e. traffic is switched, not routed between members) and sFlow provides detailed visibility into layer two traffic, including: packet sizes, Ethernet protocols, MAC addresses, VLANs, etc.
Leveraging the real-time analytics capabilities of sFlow-RT allows the IX Metrics application to provide up to the second visibility into exchange traffic. The IX Metrics application can also export metrics to InfluxDB to support operations and member facing dashboards (built using Grafana for example).  In addition, export of notification using syslog supports integration with Security Information and Event Management (SIEM) tools like Logstash.

IX Metrics is open source software that can easily be modified to integrate with other tools and additional applications can be installed on the sFlow-RT platform alongside the IX Metrics application, for example:

Docker network visibility demonstration

$
0
0
The 2 minute live demonstration shows how the open source Host sFlow agent can be used to efficiently monitor Docker networking in production environments. The demonstration shows real-time tracking of 30Gbit/s traffic flows using less than 1% of a single processor core.

Minimizing cost of visibility

$
0
0
Visibility allows orchestration systems (OpenDaylight, ONOS, OpenStack Heat, Kubernetes, Docker Storm, Apache Mesos, etc.) to adapt to changing demand by targeting resources where they are needed to increase efficiency, improve performance, and reduce costs. However, the overhead of monitoring must be low in order to realize the benefits.
An analogous observation that readers may be familiar with is the importance of minimizing costs when investing in order to maximize returns - see Vanguard Principle 3: Minimize cost
Suppose that a 100 server pool is being monitored and visibility will allow the orchestration system to realize a 10% improvement by better workload scheduling and placement - increasing the pool's capacity by 10% without the need to add an additional 10 servers and saving the associated CAPEX/OPEX costs.

The chart shows the impact that measurement overhead has in realizing the potential gains in this example. If the measurement overhead is 0%, then the 10% performance gain is fully realized. However, even a relatively modest 2% measurement overhead reduces the potential improvement to just under 8% (over a 20% drop in the potential gains). A 9% measurement overhead wipes out the potential efficiency gain and measurement overheads greater than 9% result in a net loss of capacity.

More specifically, Optimizing software defined data center and Microservices discuss the critical role of network visibility in improving cloud computing performance. Consider the task of monitoring network activity in a high traffic Docker cluster running on the 100 server pool. High performance network monitoring solutions often require at least one dedicated CPU core (if Intel DPDK, or an equivalent technology, is used to accelerate network instrumentation). Suppose the server has 24 cores, dedicating one core to monitoring is a 4.2% measurement overhead and reduces the potential efficiency gain from 10% to 5% (a drop of nearly 50%). On the other hand, industry standard sFlow uses instrumentation built into hardware and software data paths.  Docker network visibility demonstration shows how Linux kernel instrumentation can be used to monitor traffic using less than 1% of 1 CPU core, an insignificant 0.04% measurement overhead that allows the orchestration system to achieve the full 10% efficiency gain.

To conclude, visibility is essential to the operation of cloud infrastructure and can drive greater efficiency. However, the net gains in efficiency are significantly affected by any overhead imposed by monitoring. Industry standard sFlow measurement technology is widely supported, minimizes overhead, and ensure that efficiency gains are fully realizable.

Lasers!

$
0
0
Cool! You mean that I actually have frickin' switches with frickin' laser beams attached to their frickin' ports?

Dr. Evil is right, lasers are cool! The draft sFlow Optical Interface Structures specification exports metrics gathered from instrumentation built into Small Form-factor Pluggable (SFP) and Quad Small Form-factor Pluggable (QSFP) optics modules. This article provides some background on optical modules and discusses the value of including optical metrics in the sFlow telemetry stream exported from switches and hosts.
Pluggable optical modules are intelligent devices that do more than simply convert between optical and electrical signals. The functional diagram below shows the elements within a pluggable optical module.
The transmit and receive functions are shown in the upper half of the diagram. Incoming optical signals are received on a fiber and amplified as they are converted to electrical signals that can be handled by the switch. Transmit data drives the modulation of a laser diode which transmits the optical signal down a fiber.

The bottom half of the diagram shows the management components. Power, voltage and temperature sensors are monitored and the results are written into registers in an EEPROM that are accessible via a management interface.

The proposed sFlow extension standardizes the export of the module sensor data so that they can be exported along with switch port interface counters. A standard structure ensures multi-vendor interoperability and including the optical metrics as part of the sFlow export provides a scaleable method of monitoring all the optical modules in the network.
While the measurements from a single module are useful, the value increases when measurements from all modules can be combined at the sFlow collector. For example, matching pairs of modules allows problems with the transmitter, receiver and the cable connecting them to be isolated.
The sFlow counter push mechanism is an extremely efficient method of monitoring at scale and can collect metrics from all the optical modules in the data center. Combining data from all the modules makes it easier to find outliers.
Finally, incorporating optics monitoring as part of the comprehensive sFlow telemetry stream allows optical metrics to be correlated with switch port, traffic flow and application performance metrics. For example, an increase in application response time can be traced to the paths that the traffic takes across the network, packet discard rates on the ports, and signal strength from the optical sensors, to find a marginal fiber link.

Network visibility with Docker

$
0
0
Microservices describes the critical role that network visibility provides as a common point of reference for monitoring, managing and securing the interactions between the numerous and diverse distributed service instances in a microservices deployment.

Industry standard sFlow is well placed to give network visibility into the Docker infrastructure used to support microservices. The sFlow standard is widely supported by data center switch vendors (Cisco, Arista, Juniper, Dell, HPE, Brocade, Cumulus, etc.)  providing a cost effective and scaleable method of monitoring the physical network infrastructure. In addition, Linux bridge, macvlan, ipvlan, adapters described how sFlow is also an efficient means of leveraging instrumentation built into the Linux kernel to extend visibility into Docker host networking.

The following commands build the Host sFlow binary package from sources on an Ubuntu 14.04 system:
sudo apt-get update
sudo apt-get install build-essential
sudo apt-get install libpcap-dev
sudo apt-get install wget
wget https://github.com/sflow/host-sflow/archive/v1.29.1.tar.gz
tar -xvzf v1.29.1.tar.gz
cd host-sflow-1.29.1
make DOCKER=yes PCAP=yes deb
This resulting hsflowd_1.29.1-1_amd64.deb package can be copied and installed on all the hosts in the Docker cluster using configuration management tools such as Puppet, Chef, Ansible, etc.

This article will explore the alternative of deploying sFlow agents as Docker containers.

Create a directory for the project and edit the Dockerfile:
mkdir hsflowd
cp hsflowd_1.29.1-1_amd64.deb hsflowd
cd hsflowd
printf "sflow {\n dnssd=on\n pcap { dev = docker0 }\n}"> hsflowd.conf
vi Dockerfile
Add the following contents to Dockerfile:
FROM   ubuntu:trusty
RUN apt-get update && apt-get install -y libpcap0.8 docker.io
ADD hsflowd_1.29.1-1_amd64.deb /tmp
RUN dpkg -i /tmp/hsflowd_1.29.1-1_amd64.deb
ADD hsflowd.conf /etc/hsflowd.conf
CMD /etc/init.d/hsflowd start && tail -f /dev/null
Build the project:
docker build -t hsflowd .
Run the service:
docker run --pid=host --uts=host --net=host \
-v /var/run/docker.sock:/var/run/docker.sock \
-v /sys/fs/cgroup/:/sys/fs/cgroup/:ro -d hsflowd
In this example, DNS Service Discovery (DNS-SD), is being used as the configuration method for the sFlow agents. Adding the following entry to DNS zone file allows the agents to automatically discover the designated sFlow analyzers, analytics1 and analytics2, and configuration parameters:
_sflow._udp   30  SRV     0 0 6343  analytics1
_sflow._udp 30 SRV 0 0 6343 analytics2
_sflow._udp 30 TXT (
"txtvers=1"
"sampling=400"
"polling=20"
)
As soon as the container starts, the sFlow agent will make a DNS request to find the sFlow analyzers, which can themselves be packaged as Docker containers. Network and system analytics as a Docker microservice describes how sFlow analytics can be packaged as a RESTful service and integrated with a wide variety of on-site and cloud, orchestration, DevOps and Software Defined Networking (SDN) tools.

Any change to the entries in the zone file will be automatically picked up by the sFlow agents.

The agent has been configured for Docker bridged networking, monitoring traffic through bridge docker0. For macvlan or ipvlan networking, change the pcap setting from docker0 to eth0.

One of the major advantages of packaging the sFlow agents and analytics components as Docker containers is that large scale deployments can be automated using Docker Compose with Swarm, deploying sFlow agents on every node in the Swarm cluster to deliver real-time cluster-wide visibility into the resource consumption and communication patterns of all microservices running on the cluster.

Multi-tenant sFlow

$
0
0
This article discusses how real-time sFlow telemetry can be shared with network tenants to provide each tenant with a real-time view of their slice of the shared resources. The diagram shows a simple network with two tenants, Tenant A and Tenant B, each assigned their own subnet, 10.0.0.0/24 and 10.0.1.0/24 respectively.

One option would be to simply replicate the sFlow datagrams and send copies to both tenants. Forwarding using sflowtool describes how sflowtool can be used to replicate and forward sFlow and sFlow-RT can be configured to forward sFlow using its REST API:
curl -H "Content-Type:application/json" \
-X PUT --data '{"address":"10.0.0.1","port":6343}' \
http://127.0.0.1:8008/forwarding/TenantA/json
However, there are serious problems with this approach:
  1. Private information about Tenant B's traffic is leaked to Tenant A.
  2. Information from internal links within the network (i.e. links between s1, s2, s3 and s4) is leaked to Tenant A.
  3. Duplicate data from each network hop is likely to cause Tenant A to over-estimate their traffic.
The sFlow-RT multi-tenant forwarding function addresses these challenges. The first task is to provide sFlow-RT with an accurate network topology specifying the internal links connecting the switches, e.g.
curl -H "Content-Type:application/json" -X PUT --data '{\
"L1":{"node1":"s1", "port1":"s1-eth1", "node2":"s3", "port2":"s3-eth1"},\
"L2":{"node1":"s1", "port1":"s1-eth2", "node2":"s4", "port2":"s4-eth1"},\
"L3":{"node1":"s2", "port1":"s2-eth1", "node2":"s3", "port2":"s3-eth2"},\
"L4":{"node1":"s2", "port1":"s2-eth2", "node2":"s4", "port2":"s4-eth2"}\
}' http://127.0.0.1:8008/topology/json
The topology allows sFlow-RT to model the network as if it were one switch and provide this abstracted view of the sFlow data to tenants.

The following REST API call configures multi-tenant forwarding for Tenant A:
curl -H "Content-Type:application/json" -X PUT --data \
'{"collectorAddress":"10.0.0.1","collectorPort":6343, \
"filters":{"cidr":["10.0.0.0/24"]}}' \
http://127.0.0.1:8008/tenant/TenantA/json
In this example, sFlow-RT filters the sFlow sent to Tenant A to only include traffic to or from hosts within Tenant A's allocated address space, 10.0.0.0/24. In addition, only edge ports are considered -sFlow from inter-switch links is suppressed. When performing multi-tenant forwarding sFlow-RT acts as a proxy, reconstructing a valid sFlow telemetry stream based on the filtered records and re-calculating sequence numbers, sampling information, etc.

In addition to splitting sFlow telemetry by IP address, sFlow-RT can split telemetry based on switch port and MAC addresses - splitting on MAC addresses is a simple way to share sFlow telemetry between members in an Internet Exchange, see Internet Exchange (IX) Metrics.

Tenants can use whatever software they want to process the standard sFlow feed. However, standing up sFlow-RT instances for each tenant is straightforward and provides real-time network analytics through an easily consumable RESTflow API, see Network and system analytics as a Docker microservice.

Finally, network analytics is a valuable service to offer tenants and in the case of commercial service providers can be used as an additional source of revenue or as a way to differentiate the service from competitors.

Cisco SF250, SG250, SF350, SG350, SG350XG, and SG550XG series switches

$
0
0
Software version 2.1.0 adds sFlow support to Cisco 250 Series Smart Switches, 350 Series Smart Switches and 550X Series Stackable Managed Switches.
Cisco network engineers might not be familiar with the multi-vendor sFlow technology since it is a relatively new addition to Cisco products. The article, Cisco adds sFlow support, describes some of the key features of sFlow and contrasts them to Cisco NetFlow.
Configuring sFlow on the switches is straightforward. For example, The following commands configure a switch to sample packets at 1-in-1024, poll counters every 30 seconds and send sFlow to an analyzer (10.0.0.50) over UDP using the default sFlow port (6343):
sflow receiver 1 10.0.0.50
For each interface:
sflow flow-sampling 1024 1
sflow counter-sampling 30 1
A previous posting discussed the selection of sampling rates. Additional information can be found on the Cisco web site.

Trying out sFlow offers suggestions for getting started with sFlow monitoring and reporting. The article recommends the sFlowTrend analyzer as a way to get started since it is a free, purpose built sFlow analyzer that delivers the full capabilities of sFlow instrumentation in the Cisco switches.

Berkeley Packet Filter (BPF)

$
0
0
Linux bridge, macvlan, ipvlan, adapters discusses how industry standard sFlow technology, widely supported by data center switch vendors, has been extended to provide network visibility into the Linux data plane. This article explores how sFlow's lightweight packet sampling mechanism has been implemented on Linux network adapters.

Linux Socket Filtering aka Berkeley Packet Filter (BPF) describes the recently added prandom_u32() function that allows packets to be randomly sampled in the Linux kernel for efficient monitoring of production traffic.
Background: Enhancing Network Intrusion Detection With Integrated Sampling and Filtering, Jose M. Gonzalez and Vern Paxson, International Computer Science Institute Berkeley, discusses the motivation for adding random sampling BPF and the email thread [PATCH] filter: added BPF random opcode describes the Linux implementation and includes an interesting discussion of the motivation for the patch.
The following code shows how the open source Host sFlow agent implements random 1-in-256 packet sampling as a BPF program:
ld rand
mod #256
jneq #1, drop
ret #-1
drop: ret #0
A JIT for packet filters discusses the Linux Just In Time (JIT) compiler for BFP programs, delivering native machine code performance for compiled filters.

Minimizing cost of visibility describes why low overhead monitoring is an essential component for increasing efficiency in cloud infrastructure. The combination of BPF packet sampling with standard sFlow export provides a low overhead method of delivering real-time network visibility into large scale cloud infrastructure.

sFlow to IPFIX/NetFlow

$
0
0
RESTflow explains how the sFlow architecture shifts the flow cache from devices to external software and describes how the sFlow-RT REST API can be used to program and query flow caches. Exporting events using syslog describes how flow records can be exported using the syslog protocol to Security Information and Event Management (SIEM) tools such as Logstash and and Splunk. This article demonstrates how sFlow-RT can be used to define and export the flows using the IP Flow Information eXport (IPFIX) protocol (the IETF standard based on NetFlow version 9).

For example, the following command defines a cache that will maintain flow records for TCP flows on the network, capturing IP source and destination addresses, source and destination port numbers and the bytes transferred and sending flow records to address 10.0.0.162:
curl -H "Content-Type:application/json" -X PUT --data \ '{"keys":"ipsource,ipdestination,tcpsourceport,tcpdestinationport", \
"value":"bytes", "ipfixCollectors":["10.0.0.162"]}' \
http://localhost:8008/flow/tcp/json
Running Wireshark's tshark command line utility on 10.0.0.162 verifies that flows are being received:
# tshark -i eth0 -V udp port 4739
Running as user "root" and group "root". This could be dangerous.
Capturing on lo
Frame 1 (134 bytes on wire, 134 bytes captured)
Arrival Time: Aug 24, 2013 10:44:06.096082000
[Time delta from previous captured frame: 0.000000000 seconds]
[Time delta from previous displayed frame: 0.000000000 seconds]
[Time since reference or first frame: 0.000000000 seconds]
Frame Number: 1
Frame Length: 134 bytes
Capture Length: 134 bytes
[Frame is marked: False]
[Protocols in frame: eth:ip:udp:cflow]
Ethernet II, Src: 00:00:00_00:00:00 (00:00:00:00:00:00), Dst: 00:00:00_00:00:00 (00:00:00:00:00:00)
Destination: 00:00:00_00:00:00 (00:00:00:00:00:00)
Address: 00:00:00_00:00:00 (00:00:00:00:00:00)
.... ...0 .... .... .... .... = IG bit: Individual address (unicast)
.... ..0. .... .... .... .... = LG bit: Globally unique address (factory default)
Source: 00:00:00_00:00:00 (00:00:00:00:00:00)
Address: 00:00:00_00:00:00 (00:00:00:00:00:00)
.... ...0 .... .... .... .... = IG bit: Individual address (unicast)
.... ..0. .... .... .... .... = LG bit: Globally unique address (factory default)
Type: IP (0x0800)
Internet Protocol, Src: 10.0.0.162 (10.0.0.162), Dst: 10.0.0.162 (10.0.0.162)
Version: 4
Header length: 20 bytes
Differentiated Services Field: 0x00 (DSCP 0x00: Default; ECN: 0x00)
0000 00.. = Differentiated Services Codepoint: Default (0x00)
.... ..0. = ECN-Capable Transport (ECT): 0
.... ...0 = ECN-CE: 0
Total Length: 120
Identification: 0x0000 (0)
Flags: 0x02 (Don't Fragment)
0.. = Reserved bit: Not Set
.1. = Don't fragment: Set
..0 = More fragments: Not Set
Fragment offset: 0
Time to live: 64
Protocol: UDP (0x11)
Header checksum: 0x2532 [correct]
[Good: True]
[Bad : False]
Source: 10.0.0.162 (10.0.0.162)
Destination: 10.0.0.162 (10.0.0.162)
User Datagram Protocol, Src Port: 56109 (56109), Dst Port: ipfix (4739)
Source port: 56109 (56109)
Destination port: ipfix (4739)
Length: 100
Checksum: 0x15b9 [validation disabled]
[Good Checksum: False]
[Bad Checksum: False]
Cisco NetFlow/IPFIX
Version: 10
Length: 92
Timestamp: Aug 24, 2013 10:44:06.000000000
ExportTime: 1377366246
FlowSequence: 74
Observation Domain Id: 0
Set 1
Template FlowSet: 2
FlowSet Length: 40
Template (Id = 258, Count = 8)
Template Id: 258
Field Count: 8
Field (1/8)
.000 0000 1000 0010 = Type: exporterIPv4Address (130)
Length: 4
Field (2/8)
.000 0000 1001 0110 = Type: flowStartSeconds (150)
Length: 4
Field (3/8)
.000 0000 1001 0111 = Type: flowEndSeconds (151)
Length: 4
Field (4/8)
.000 0000 0000 1000 = Type: IP_SRC_ADDR (8)
Length: 4
Field (5/8)
.000 0000 0000 1100 = Type: IP_DST_ADDR (12)
Length: 4
Field (6/8)
.000 0000 1011 0110 = Type: TCP_SRC_PORT (182)
Length: 2
Field (7/8)
.000 0000 1011 0111 = Type: TCP_DST_PORT (183)
Length: 2
Field (8/8)
.000 0000 0101 0101 = Type: BYTES_TOTAL (85)
Length: 8
Set 2
DataRecord (Template Id): 258
DataRecord Length: 36
Flow 1
ExporterAddr: 10.0.0.20 (10.0.0.20)
[Duration: 65.000000000 seconds]
StartTime: Aug 24, 2013 10:43:01.000000000
EndTime: Aug 24, 2013 10:44:06.000000000
SrcAddr: 10.0.0.16 (10.0.0.16)
DstAddr: 10.0.0.20 (10.0.0.20)
SrcPort: 48859
DstPort: 443
Octets: 228045
The output demonstrates how the flow cache definition is exported as an IPFIX Template and the individual flow records are exported as one or more Flow entries within a DataRecord.

What might not be apparent is that the single configuration command to sFlow-RT enabled network wide monitoring of TCP connections, even in a network containing hundreds of physical switches, thousands of virtual switches, different switch models, multiple vendors etc. In contrast, if devices maintain their own flow caches then each switch needs to be re-configured whenever monitoring requirements change - typically a time consuming and complex manual process, see Software defined analytics.
While IPFIX provides a useful method of exporting IP flow records to legacy monitoring solutions, logging flow records is only a small subset of the applications for sFlow analytics. The real-time networking, server, and application analytics provided by sFlow-RT delivers actionable data through APIs and can easily be integrated with a wide variety of on-site and cloud, orchestration, DevOps and Software Defined Networking (SDN) tools.

Black hole detection

$
0
0
The Broadcom white paper, Black Hole Detection by BroadView™ Instrumentation Software, describes the challenge of detecting and isolating packet loss caused by inconsistent routing in leaf-spine fabrics. The diagram from the paper provides an example, packets from host H11 to H22 are being forwarded by ToR1 via Spine1 to ToR2 even though the route to H22 has been withdrawn from ToR2. Since ToR2 doesn't have a route to the host, it sends the packet back up to Spine 2, which will send the packet back to ToR2, causing the packet to bounce back and forth until the IP time to live (TTL) expires.

The white paper discusses how Broadcom ASICs can be programmed to detect blackholes based on packet paths, i.e. packets arriving at a ToR switch from a Spine switch should never be forwarded to another Spine switch.

This article will discuss how the industry standard sFlow instrumentation (also included in Broadcom based switches) can be used to provide fabric wide detection of black holes.

The diagram shows a simple test network built using Cumulus VX virtual machines to emulate a four switch leaf-spine fabric like the one described in the Broadcom white paper (this network is described in Open Virtual Network (OVN) and Network virtualization visibility demo). The emulation of the control plane is extremely accurate since the same Cumulus Linux distribution that runs on physical switches is running in the Cumulus VX virtual machine. In this case BGP is being used as the routing protocol (see BGP configuration made simple with Cumulus Linux).

The same open source Host sFlow agent is running on the Linux servers and switches, streaming real-time telemetry over the out of band management network to sFlow analysis software running on the management server.
Fabric View is an open source application, running on the sFlow-RT real-time analytics engine, designed to monitor the performance of leaf-spine fabrics. The sFlow-RT Download page has instructions for downloading and installing sFlow-RT and Fabric View.

The Fabric View application needs two pieces of configuration information: the network topology and the address allocation.

Topology discovery with Cumulus Linux describes how to extract the topology in a Cumulus Linux network, yielding the following topology.json file:
{
"links": {
"leaf2-spine2": {
"node1": "leaf2", "port1": "swp2",
"node2": "spine2", "port2": "swp2"
},
"leaf1-spine1": {
"node1": "leaf1", "port1": "swp1",
"node2": "spine1", "port2": "swp1"
},
"leaf1-spine2": {
"node1": "leaf1", "port1": "swp2",
"node2": "spine2", "port2": "swp1"
},
"leaf2-spine1": {
"node1": "leaf2", "port1": "swp1",
"node2": "spine1", "port2": "swp2"
}
}
}
And the following groups.json file lists the /24 address blocks allocated to hosts connected to each leaf switch:
{
"external":["0.0.0.0/0"],
"rack1":["192.168.1.0/24"],
"rack2":["192.168.2.0/24"]
}
Defining Flows describes how sFlow-RT can be programmed to perform flow analytics. The following JavaScript file implements the blackhole detection and can be installed in the sflow-rt/app/fabric-view/scripts/ directory:
// track flows that are sent back to spine
var pathfilt = 'node:inputifindex~leaf.*';
pathfilt += '&link:inputifindex!=null';
pathfilt += '&link:outputifindex!=null';
setFlow('fv-blackhole-path',
{keys:'group:ipdestination:fv',value:'frames', filter:pathfilt,
log:true, flowStart:true}
);

// track locally originating flows that have TTL indicating non shortest path
var diam = 2;
var ttlfilt = 'range:ipttl:0:'+(64-diam-2)+'=true';
ttlfilt += '&group:ipsource:fv!=external';
setFlow('fv-blackhole-ttl',
{keys:'group:ipdestination:fv,ipttl', value:'frames', filter:ttlfilt,
log:true, flowStart:true}
);

setFlowHandler(function(rec) {
var parts, msg = {'type':'blackhole'};
switch(rec.name) {
case 'fv-blackhole-path':
msg.rack = rec.flowKeys;
break;
case 'fv-blackhole-ttl':
var [rack,ttl] = rec.flowKeys.split(',');
msg.rack = rack;
msg.ttl = ttl;
break;
}
var port = topologyInterfaceToPort(rec.agent,rec.dataSource);
if(port && port.node) msg.node = port.node;
logWarning(JSON.stringify(msg));
},['fv-blackhole-path','fv-blackhole-ttl']);
Some notes on the script:
  • The fv-blackhole-path flow definition has a filter that matches packets that arrive on an inter switch link and are sent back on another link (the rule described in the Broadcom paper.)
  • The fv-blackhole-ttl script relies on the fact that the servers are running Linux which uses an initial TTL of 64. Since it only takes 3 routing hops to traverse the leaf-spine fabric, any TTL values of 60 or smaller are an indication of a potential routing loop and black hole.
  • Flow records are generated as soon as a match is found and the setFlowHandler() function is uses to process the records, in this case logging warning messages.
Under normal operation no warning are generated. Adding static routes to leaf2 and spine1 to create a loop to blackhole packets results in the following output:
$ ./start.sh 
2016-05-17T19:47:37-0700 INFO: Listening, sFlow port 9343
2016-05-17T19:47:38-0700 INFO: Starting the Jetty [HTTP/1.1] server on port 8008
2016-05-17T19:47:38-0700 INFO: Starting com.sflow.rt.rest.SFlowApplication application
2016-05-17T19:47:38-0700 INFO: Listening, http://localhost:8008
2016-05-17T19:47:38-0700 INFO: app/fabric-view/scripts/fabric-view-stats.js started
2016-05-17T19:47:38-0700 INFO: app/fabric-view/scripts/blackhole.js started
2016-05-17T19:47:38-0700 INFO: app/fabric-view/scripts/fabric-view.js started
2016-05-17T19:47:38-0700 INFO: app/fabric-view/scripts/fabric-view-elephants.js started
2016-05-17T19:47:38-0700 INFO: app/fabric-view/scripts/fabric-view-usr.js started
2016-05-17T20:50:33-0700 WARNING: {"type":"blackhole","rack":"rack2","ttl":"13","node":"leaf2"}
2016-05-17T20:50:48-0700 WARNING: {"type":"blackhole","rack":"rack2","node":"leaf2"}
Exporting events using syslog describes how to send events to SIEM tools like Logstash or Splunk so that they can be queried. The script can also be extended to perform further analysis, or to automatically apply remediation controls.
This example demonstrates the versatility of the sFlow architecture, shifting flow analytics from devices to external software makes it easy to deploy new capabilities. The real-time networking, server, and application analytics provided by sFlow-RT delivers actionable data through APIs and can easily be integrated with a wide variety of on-site and cloud, orchestration, DevOps and Software Defined Networking (SDN) tools.

Identifying bad ECMP paths

$
0
0
In the talk Move Fast, Unbreak Things! at the recent DevOps Networking Forum,  Petr Lapukhov described how Facebook has tackled the problem of detecting packet loss in Equal Cost Multi-Path (ECMP) networks. At Facebook's scale,  there are many parallel paths and actively probing all the paths generates a lot of data. The active tests generate over 1Terabits/second of measurement data per Facebook data center and a Hadoop cluster with hundreds of compute nodes is required per data center to process the data.

Processing active test data can detect that packets are being lost within approximately 20 seconds, but doesn't provide the precise location where packets are dropped. A custom multi-path traceroute tool (fbtracert) is used to follow up and narrow down the location of the packet loss.

While described as measuring packet loss, the test system is really measuring path loss. For example, if there are 64 ECMP paths in a pod, then the loss of one path would result in a packet loss of approximately 1 in 64 packets in traffic flows that cross the ECMP group.

Black hole detection describes an alternative approach. Industry standard sFlow instrumentation embedded within most vendor's switch hardware provides visibility into the paths that packets take across the network - see Packet paths. In some ways the sFlow telemetry is very similar to the traceroute tests, each measurement identifies the specific location a packet was seen.

The passive sFlow monitoring approach has significant benefits:
  1. Eliminates active test traffic since production traffic exercises network paths.
  2. Eliminates traffic generators and test targets required to perform the active tests.
  3. Simplifies analysis since sFlow measurements provides a direct indication of anomaly location.
  4. Reduced operation complexity and associated costs.
Enabling sFlow throughout the network continuously monitors all paths and can rapidly detect routing anomalies. In addition, sFlow is a general purpose solution that delivers the visibility needed to manage leaf-spine networks and the distributed applications that they support. The following examples are illustrative of the breadth of solution supported by sFlow analytics:

Mininet flow analytics

$
0
0
Mininet is free software that creates a realistic virtual network, running real kernel, switch and application code, on a single machine (VM, cloud or native), in seconds. Mininet is useful for development, teaching, and research. Mininet is also a great way to develop, share, and experiment with OpenFlow and Software-Defined Networking systems.

This article shows how standard sFlow instrumentation built into Mininet can be combined with sFlow-RT analytics software to provide real-time traffic visibility for Mininet networks. Augmenting Mininet with sFlow telemetry realistically emulates the instrumentation built into most vendor's switch hardware, provides visibility into Mininet experiments, and opens up new areas of research (e.g. SDN and large flows).

The following papers are a small selection of projects using sFlow-RT:
In order to make it easier to get started, the latest release of sFlow-RT includes a Mininet helper script sflow.py that automates sFlow configuration. The following example shows how to use the script and build a simple application in Python.

Install sFlow-RT on the Mininet host:
wget http://www.inmon.com/products/sFlow-RT/sflow-rt.tar.gz
tar -xvzf sflow-rt.tar.gz
cd sflow-rt
./start.sh
In a second terminal, add the --custom argument to the Mininet command line. For example, the following command builds a depth 2 tree topology with link bandwidths of 10Mbit/s
cd sflow-rt
sudo mn --custom extras/sflow.py --link tc,bw=10 --topo tree,depth=2,fanout=2
The sflow.py script extends Mininet, automatically enabling sFlow on each of the switches in the topology, and posting a JSON representation of the Mininet topology using sFlow-RT's REST API.

Traffic engineering of large "Elephant" flows is an active area of research. The following Python script, elephant.py, demonstrates how Elephant flows can be detected using sFlow-RT REST API calls:
#!/usr/bin/env python
import requests
import json

rt = 'http://127.0.0.1:8008'

flow = {'keys':'link:inputifindex,ipsource,ipdestination','value':'bytes'}
requests.put(rt+'/flow/pair/json',data=json.dumps(flow))

threshold = {'metric':'pair','value':1000000/8,'byFlow':True,'timeout':1}
requests.put(rt+'/threshold/elephant/json',data=json.dumps(threshold))

eventurl = rt+'/events/json?thresholdID=elephant&maxEvents=10&timeout=60'
eventID = -1
while 1 == 1:
r = requests.get(eventurl + "&eventID=" + str(eventID))
if r.status_code != 200: break
events = r.json()
if len(events) == 0: continue

eventID = events[0]["eventID"]
events.reverse()
for e in events:
print e['flowKey']
Some notes on the script:
  • The link:inputifindex function in the flow definition identifies the link in the topology associated with the ingress port on the Mininet switch, see Defining Flows
  • The script defines an Elephant flow as a flow that consumes 10% of the link bandwidth. In this example Mininet was configured with a link bandwidth of 10Mbit/s so an Elephant is a flow that exceeds 1Mbit/s. Since the specified flow measures traffic in bytes/second the threshold needs to be converted by bytes/second (dividing by 8).
  • The sFlow-RT REST API uses long-polling as a method of asynchronously pushing events to the client. The events HTTP request blocks until there are new events or a timeout occurs. The client immediately reconnects after receiving a response to wait for further events. 
See Writing Applications for additional information.

Start the script:
$ ./elephant.py
Run an iperf test using the Mininet CLI:
mininet> iperf h1 h3
*** Iperf: testing TCP bandwidth between h1 and h3
*** Results: ['9.06 Mbits/sec', '9.98 Mbits/sec']
The following results should appear as soon as the flow is detected:
$ ./elephant.py 
s1-s2,10.0.0.1,10.0.0.3
s1-s3,10.0.0.1,10.0.0.3
The output identifies the links carrying the flow between h1 and h3 and shows the IP addresses of the hosts.
The sFlow-RT web interface provides basic charting capabilities. The chart above shows a sequence of iperf tests.

The Python script can easily be modified to address a number of interesting use cases. Instead of simply printing events, a REST call can be made to an OpenFlow controller (POX, OpenDaylight, Floodlight, ONOS, etc) to apply controls to mark, mirror, load balance, rate limit, or block flows.

Mininet dashboard

$
0
0
Mininet Dashboard has been released on GitHub, https://github.com/sflow-rt/mininet-dashboard. Follow the steps in Mininet flow analytics to install sFlow-RT and configure sFlow instrumentation in Mininet.

The following steps install the dashboard and start sFlow-RT:
cd sflow-rt
./get-app sflow-rt mininet-dashboard
./start.sh
The dashboard web interface shown in the screen shot should now be accessible. Run a test to see data in the dashboard. The following test created the results shown:
sudo mn --custom extras/sflow.py --link tc,bw=10 --topo tree,depth=2,fanout=2 --test iperf
The dashboard has three time series charts that update every second and show five minutes worth of data. From top to bottom, the charts are:
  1. Top Flows - Click on a peak in the chart to see the flows that were active at that time.
  2. Top Ports - Click on a peak in the chart to see the ingress ports that were active at that time.
  3. Topology Diameter - The diameter of the topology.
The dashboard application is easily modified to add additional metrics, generate events, or implement controls. For example, adding the following code to the end of the sflow-rt/app/mininet-dashboard/scripts/metrics.js file implements equivalent functionality to the large flow detection Python script described in Mininet flow analytics:
setFlow('pair',
{'keys':'link:inputifindex,ipsource,ipdestination','value':'bytes'});

setThreshold('elephant',
{'metric':'pair','value':1000000/8,'byFlow':true,'timeout':1});

setEventHandler(function(evt) {
logInfo(evt.flowKey);
},['elephant']);
Restart sFlow-RT and repeat the iperf test and the following events should be logged:
$ ./start.sh 
2016-05-21T18:00:03-0700 INFO: Listening, sFlow port 6343
2016-05-21T18:00:03-0700 INFO: Starting the Jetty [HTTP/1.1] server on port 8008
2016-05-21T18:00:03-0700 INFO: Starting com.sflow.rt.rest.SFlowApplication application
2016-05-21T18:00:03-0700 INFO: Listening, http://localhost:8008
2016-05-21T18:00:03-0700 INFO: app/mininet-dashboard/scripts/metrics.js started
2016-05-21T18:00:12-0700 INFO: s1-s2,10.0.0.1,10.0.0.4
2016-05-21T18:00:12-0700 INFO: s1-s3,10.0.0.1,10.0.0.4
See Writing Application for more information.

OpenNSL

$
0
0
Open Network Switch Layer (OpenNSL) is a library of network switch APIs that is openly available for programming Broadcom network switch silicon based platforms. These open APIs enable development of networking application software based on Broadcom network switch architecture based platforms.

The recent inclusion of the APIs needed to enable sFlow instrumentation in Broadcom hardware allows open source network operating systems such as OpenSwitch and Open Network Linux to implement the sFlow telemetry standard.

Raspberry Pi real-time network analytics

$
0
0
The Raspberry Pi model 3b is not much bigger than a credit card, costs $35, runs Linux, has a 1G RAM, and powerful 4 core 64 bit ARM processor. This article will demonstrate how to turn the Raspberry Pi into a Terribit/second real-time network analytics engine capable of monitoring hundreds of switches and thousands of switch ports.
The diagram shows how the sFlow-RT real-time analytics engine receives a continuous telemetry stream from industry standard sFlow instrumentation build into network, server and application infrastructure and delivers analytics through APIs and can easily be integrated with a wide variety of on-site and cloud, orchestration, DevOps and Software Defined Networking (SDN) tools.
A future article will examine how the Host sFlow agent can be used to efficiently stream measurements from large numbers of inexpensive Rasberry Pi devices ($5 for model Zero) to the sFlow-RT collector to monitor and control the "Internet of Things" (IoT).
The following instructions show how to install sFlow-RT on Raspbian Jesse (the Debian Linux based Raspberry Pi operating system).
wget http://www.inmon.com/products/sFlow-RT/sflow-rt_2.0-1092.deb
sudo dpkg -i --ignore-depends=openjdk-7-jre-headless sflow-rt_2.0-1092.deb
We are ignoring the dependency on openjdk and will use the default Raspbian Java 1.8 version instead.

Next, edit /usr/local/sflow-rt/conf.d/sflow-rt.jvm and replace teh default settings with the following:
-Xms600M
-Xmx600M
-XX:+UseParNewGC
-XX:+UseConcMarkSweepGC
-XX:+CMSIncrementalMode
These new settings reduce the requested memory to fit within the 1G on the Raspberry Pi and leave some memory for system tasks. The G1GC garbage collector not available on ARM Java implementation, so we will use incremental concurrent mark and sweep instead.

Start the sFlow-RT daemon:
sudo service sflow-rt start
The sFlow-RT web interface should now be accessible at http://<raspberrypi_ip>:8008/

Finally, Agents provides information on configuring devices to send sFlow to the Raspberry Pi analyzer. Visit the http://<raspberrypi_ip>:8008/agents/html page to verify that data is being received.

Writing Applications provides an overview of the sFlow-RT APIs. For example, run the following Python script on the Raspberry Pi to log traffic flows that exceed 100Mbits/second:
#!/usr/bin/env python
import requests
import json

rt = 'http://127.0.0.1:8008'

flow = {'keys':'ipsource,ipdestination','value':'bytes'}
requests.put(rt+'/flow/pair/json',data=json.dumps(flow))

threshold = {'metric':'pair','value':100000000/8,'byFlow':True,'timeout':1}
requests.put(rt+'/threshold/elephant/json',data=json.dumps(threshold))

eventurl = rt+'/events/json?thresholdID=elephant&maxEvents=10&timeout=60'
eventID = -1
while 1 == 1:
r = requests.get(eventurl + "&eventID=" + str(eventID))
if r.status_code != 200: break
events = r.json()
if len(events) == 0: continue

eventID = events[0]["eventID"]
events.reverse()
for e in events:
print e['flowKey']
In addition, there are a number of open source sFlow-RT Applications available on the Downloads page (e.g. Mininet dashboard, DDoS mitigation, etc.) and articles describing use cases for sFlow-RT on this blog.
Viewing all 347 articles
Browse latest View live