Quantcast
Viewing all 350 articles
Browse latest View live

Network performance monitoring

Today, network performance monitoring typically relies on probe devices to perform active tests and/or observe network traffic in order to try and infer performance. This article demonstrates that hosts already track network performance and that exporting host-based network performance information provides an attractive alternative to complex and expensive in-network approaches.
# tcpdump -ni eth0 tcp
11:29:28.949783 IP 10.0.0.162.ssh > 10.0.0.70.56174: Flags [P.], seq 1424968:1425312, ack 1081, win 218, options [nop,nop,TS val 2823262261 ecr 2337599335], length 344
11:29:28.950393 IP 10.0.0.70.56174 > 10.0.0.162.ssh: Flags [.], ack 1425312, win 4085, options [nop,nop,TS val 2337599335 ecr 2823262261], length 0
The host TCP/IP stack continuously measured round trip time and estimates available bandwidth for each active connection as part of its normal operation. The tcpdump output shown above highlights timestamp information that is exchanged in TCP packets to provide the accurate round trip time measurements needed for reliable high speed data transfer.

The open source Host sFlow agent already makes use of Berkeley Packet Filter (BPF) capability on Linux to efficiently sample packets and provide visibility into traffic flows. Adding support for the tcp_diag kernel module allows the detailed performance metrics maintained in the Linux TCP stack to be attached to each sampled TCP packet.
enum packet_direction {
unknown = 0,
received = 1,
sent = 2
}

/* TCP connection state */
/* Based on Linux struct tcp_info */
/* opaque = flow_data; enterprise=0; format=2209 */
struct extended_tcp_info {
packet_direction dir; /* Sampled packet direction */
unsigned int snd_mss; /* Cached effective mss, not including SACKS */
unsigned int rcv_mss; /* Max. recv. segment size */
unsigned int unacked; /* Packets which are "in flight" */
unsigned int lost; /* Lost packets */
unsigned int retrans; /* Retransmitted packets */
unsigned int pmtu; /* Last pmtu seen by socket */
unsigned int rtt; /* smoothed RTT (microseconds) */
unsigned int rttvar; /* RTT variance (microseconds) */
unsigned int snd_cwnd; /* Sending congestion window */
unsigned int reordering; /* Reordering */
unsigned int min_rtt; /* Minimum RTT (microseconds) */
}
The sFlow telemetry protocol is extensible, and the above structure was added to transport network performance metrics along with the sampled TCP packet.
startSample ----------------------
sampleType_tag 0:1
sampleType FLOWSAMPLE
sampleSequenceNo 153026
sourceId 0:2
meanSkipCount 10
samplePool 1530260
dropEvents 0
inputPort 1073741823
outputPort 2
flowBlock_tag 0:2209
tcpinfo_direction sent
tcpinfo_send_mss 1448
tcpinfo_receive_mss 536
tcpinfo_unacked_pkts 0
tcpinfo_lost_pkts 0
tcpinfo_retrans_pkts 0
tcpinfo_path_mtu 1500
tcpinfo_rtt_uS 773
tcpinfo_rtt_uS_var 137
tcpinfo_send_congestion_win 10
tcpinfo_reordering 3
tcpinfo_rtt_uS_min 0

flowBlock_tag 0:1
flowSampleType HEADER
headerProtocol 1
sampledPacketSize 84
strippedBytes 4
headerLen 66
headerBytes 08-00-27-09-5C-F7-08-00-27-B8-32-6D-08-00-45-C0-00-34-60-79-40-00-01-06-03-7E-0A-00-00-88-0A-00-00-86-84-47-00-B3-50-6C-E7-E7-D8-49-29-17-80-10-00-ED-15-34-00-00-01-01-08-0A-18-09-85-3A-23-8C-C6-61
dstMAC 080027095cf7
srcMAC 080027b8326d
IPSize 66
ip.tot_len 52
srcIP 10.0.0.136
dstIP 10.0.0.134
IPProtocol 6
IPTOS 192
IPTTL 1
IPID 31072
TCPSrcPort 33863
TCPDstPort 179
TCPFlags 16
endSample ----------------------
The sflowtool output shown above provides an example. The tcp_info values are highlighted.

Combining performance data and packet headers delivers a telemetry stream that is far more useful than either measurement on its own. There are hundreds of attributes and billions of values that can be decoded from the packet header resulting in a virtually infinite number of permutations that combine with the network performance data.

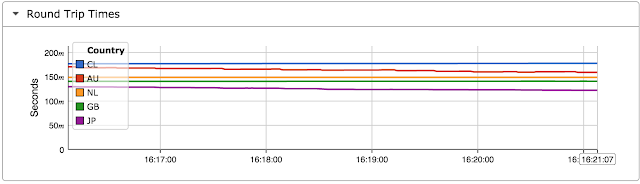
For example, the chart at the top of this article uses sFlow-RT real-time analytics software to combine telemetry from multiple hosts and generate an up to the second view of network performance, plotting round trip time by Country.

This solution leverages the TCP/IP stack to turn every host and its clients (desktops, laptops, tablets, smartphones, IoT devices, etc.) into a network performance monitoring probe - continuously streaming telemetry gathered from normal network activity.

A host-based approach to network performance monitoring is well suited to public cloud deployments, where lack of access to the physical network resources challenges in-network approaches to monitoring.
More generally, each network, host and application entity maintains state as part of its normal operation (for example, the TCP metrics in the host). However, the information is incomplete and of limited value when it is stranded within each device. The sFlow standard specifies a unified data model and efficient transport that allows each element to stream measurements and related meta-data to analytics software where the information is combined to provide a comprehensive view of performance.

SC16 live real-time weathermaps

Connect to https://inmon.sc16.org/sflow-rt/app/sc16-weather/html/ between now and November 17th to see a real-time heat map of the The International Conference for High Performance Computing, Networking, Storage and Analysis (SC16) network.

From the SCinet web page, "The Fastest Network Connecting the Fastest Computers: SC16 will host the most powerful and advanced networks in the world – SCinet. Created each year for the conference, SCinet brings to life a very high-capacity network that supports the revolutionary applications and experiments that are a hallmark of the SC conference."

The real-time weathermap leverages industry standard sFlow instrumentation built into network switch and router hardware to provide scaleable monitoring of the SCinet network. Link colors are updated every second to reflect operational status and utilization of each link.
Clicking on a link in the map pops up a 1 second resolution strip chart showing the protocol mix carried by the link.
OSiRIS (Open Storage Research Infrastructure) is a "distributed, multi-institutional storage infrastructure that lets researchers write, manage, and share data from their own computing facility locations."

Connect to http://inmon.sc16.org/sflow-rt/app/OSiRIS-weather/html/ to see an animated diagram of the SC16 OSiRIS demonstration connecting SCinet with University of Michigan, Michigan State, Wayne State, Indiana University, USGS, and Utah Cloudlab. Click on any of the links in the diagram to see traffic.
Connect to https://inmon.sc16.org/sflow-rt/app/world-map/html/ to see a real-time view of traffic from SCinet to different countries.

The SCinet real-time weathermaps were constructed using open source components (https://github.com/pphaal/sc15-weather, https://github.com/sflow-rt/svg-weather, https://github.com/sflow-rt/dashboard-example, and https://github.com/sflow-rt/world-map) running on a single instance of the sFlow-RT real-time analytics engine. See Writing Applications and download sFlow-RT to see what you can build.

Monitoring at Terabit speeds

The chart was generated from industry standard sFlow telemetry from the switches and routers comprising The International Conference for High Performance Computing, Networking, Storage and Analysis (SC16) network. The chart shows a number of conference participants pushing the network to see how much data they can transfer, peaking at a combined bandwidth of 3 Terabits/second over a minute just before noon and sustaining over 2.5 Terabits/second for over an hour. The traffic is broken out by MAC vendors code: routed traffic can be identified by router vendor (Juniper, Brocade, etc.) and layer 2 transfers (RDMA over Converged Ethernet) are identified by host adapter vendor codes (Mellanox, Hewlett-Packard Enterprise, etc.).

From the SCinet web page, "The Fastest Network Connecting the Fastest Computers: SC16 will host the most powerful and advanced networks in the world – SCinet. Created each year for the conference, SCinet brings to life a very high-capacity network that supports the revolutionary applications and experiments that are a hallmark of the SC conference."

SC16 live real-time weathermaps provides additional demonstrations of high performance network monitoring.

IPv6 Internet router using merchant silicon

Internet router using merchant silicon describes how a commodity white box switch can be used as a replacement for an expensive Internet router. The solution combines standard sFlow instrumentation implemented in merchant silicon with BGP routing information to selectively install only active routes into the hardware.

The article describes a simple self contained solution that uses standard APIs and should be able to run on a variety of Linux based network operating systems, including: Cumulus Linux, Dell OS10, Arista EOS, and Cisco NX-OS.

The diagram shows the elements of the solution. Standard sFlow instrumentation embedded in the merchant silicon ASIC data plane in the white box switch provides real-time information on traffic flowing through the switch. The sFlow agent is configured to send the sFlow to an instance of sFlow-RT running on the switch. The Bird routing daemon is used to handle the BGP peering sessions and to install routes in the Linux kernel using the standard netlink interface. The network operating system in turn programs the switch ASIC with the kernel routes so that packets are forwarded by the switch hardware and not by the kernel software.

The key to this solution is Bird's multi-table capabilities. The full Internet routing table learned from BGP peers is installed in a user space table that is not reflected into the kernel. A BGP session between sFlow-RT analytics software and Bird allows sFlow-RT to see the full routing table and combine it with the sFlow telemetry to perform real-time BGP route analytics and identify the currently active routes. A second BGP session allows sFlow-RT to push routes to Bird which in turn pushes the active routes to the kernel, programming the ASIC.

This article extends the previous example to add IPv6 routing. In this example, the following Bird configuration, /etc/bird/bird6.conf, was installed on the switch:
# Please refer to the documentation in the bird-doc package or BIRD User's
# Guide on http://bird.network.cz/ for more information on configuring BIRD and
# adding routing protocols.

# Change this into your BIRD router ID. It's a world-wide unique identification
# of your router, usually one of router's IPv6 addresses.
router id 10.0.0.136;

# The Kernel protocol is not a real routing protocol. Instead of communicating
# with other routers in the network, it performs synchronization of BIRD's
# routing tables with the OS kernel.
protocol kernel {
scan time 60;
scan time 2;
import all;
export all;
}

# The Device protocol is not a real routing protocol. It doesn't generate any
# routes and it only serves as a module for getting information about network
# interfaces from the kernel.
protocol device {
scan time 60;
}

protocol direct {
interface "*";
}

# Create a new table (disconnected from kernel/master) for peering routes
table peers;

protocol bgp peer_65134 {
table peers;
igp table master;
local as 65136;
neighbor fc00:136::2 as 65134;
source address fc00:136::1;
import all;
export all;
}

protocol bgp peer_65135 {
table peers;
igp table master;
local as 65136;
neighbor fc00:136::3 as 65135;
source address fc00:136::1;
import all;
export all;
}

# Copy default route from peers table to master table
protocol pipe {
table peers;
peer table master;
import none;
export filter {
if net ~ [ ::/0 ] then accept;
reject;
};
}

# Reflect peers table to sFlow-RT
protocol bgp to_sflow_rt {
table peers;
igp table master;
local as 65136;
neighbor ::1 port 1179 as 65136;
import none;
export all;
}

# Receive active prefixes from sFlow-RT
protocol bgp from_sflow_rt {
local as 65136;
neighbor fc00:136::1 port 1179 as 65136;
import all;
export none;
}
The open source Active Route Manager (ARM) application has been installed in sFlow-RT and the following sFlow-RT configuration, /usr/local/sflow-rt/conf.d/sflow-rt.conf, adds the IPv6 BGP route reflector and control sessions with Bird:
bgp.start=yes
arm.reflector.ip=127.0.0.1
arm.reflector.ip6=::1
arm.reflector.as=65136
arm.reflector.id=0.0.0.1
arm.sflow.ip=10.0.0.136
arm.target.ip = 10.0.0.136
arm.target.ip6=fc00:136::1
arm.target.as=65136
arm.target.id=0.0.0.2
arm.target.prefixes=10000
arm.target.prefixes6=5000
Once configured, operation is entirely automatic. As soon as traffic starts flowing to a new route, the route is identified and installed in the ASIC. If the route later becomes inactive, it is automatically removed from the ASIC to be replaced with a different active route. In this case, the maximum number of routes allowed in the ASIC has been specified as 5,000. This number can be changed to reflect the capacity of the hardware.
The Active Route Manager application has a web interface that provides up to the second visibility into the number of routes, routes installed in hardware, amount of traffic, hardware and software resource utilization etc. In addition, the sFlow-RT REST API can be used to make additional queries.

Monitoring Linux services

Mainstream Linux distributions have moved to systemd to manage daemons (e.g. httpd, sshd, etc.). The diagram illustrates how systemd runs each daemon within its own container so that it can maintain tight control of the daemon's resources.

This article describes how to use the open source Host sFlow agent to gather telemetry from daemons running under systemd.

Host sFlow systemd monitoring exports a standard set of metrics for each systemd service - the sFlow Host Structures extension defines metrics for Virtual Nodes (virtual machines, containers, etc.) that are used to export Xen, KVM, Docker, and Java resource usage. Exporting the standard metrics for systemd services provides interoperability with sFlow analyzers, allowing them to report on Linux services using existing virtual node monitoring capabilities.

While running daemons within containers helps systemd maintain control of the resources, it also provides a very useful abstraction for monitoring. For example, a single service (like the Apache web server) may consist of dozens of processes. Reporting on container level metrics abstracts away the per-process details and gives a view of the total resources consumed by the service. In addition, service metadata (like the service name) provides a useful way of identifying and grouping services, for example, making it easy to report on total CPU consumed by the web service across a pool of servers.

Systemd monitoring is easy to set up.

First download and install the latest software release.

Next, enable the systemd module by adding the highlighted line in the /etc/hsflowd.conf file:
sflow{
collector{ ip=10.0.0.1 }
systemd{}
}
This is a minimal configuration that sends sFlow telemetry to a collector running on host 10.0.0.1. The Host sFlow agent is capable of gathering an extensive set of network, system and application level metrics. See Configuring Host sFlow for Linux for a full set of options.

Finally, start the agent:
sudo systemctl enable hsflowd.service
sudo systemctl start hsflowd.service
For the best accuracy, enable systemd cgroup accounting by adding the following entries to the /etc/systemd/system.conf file and rebooting the server:
DefaultCPUAccounting=yes
DefaultBlockIOAccounting=yes
DefaultMemoryAccounting=yes
The Host sFlow agent will automatically detect when cgroup accounting has been enabled. However, if cgroup accounting hasn't been enabled, it is still able to compute and export statistics, although it might miss contributions from short lived processes.

Once the agents have been configured, verify that sFlow telemetry is being received at the collector using sflowtool. The simplest way to run sflowtool is using Docker:
docker run -p 6343:6343/udp sflow/sflowtool
The following output shows the statistics exported for the apache2 service:
startSample ----------------------
sampleType_tag 0:2
sampleType COUNTERSSAMPLE
sampleSequenceNo 50
sourceId 3:112270
counterBlock_tag 0:2103
vdsk_capacity 0
vdsk_allocation 0
vdsk_available 0
vdsk_rd_req 0
vdsk_rd_bytes 0
vdsk_wr_req 0
vdsk_wr_bytes 0
vdsk_errs 0
counterBlock_tag 0:2102
vmem_memory 16674816
vmem_maxMemory 0
counterBlock_tag 0:2101
vcpu_state 1
vcpu_cpu_mS 180
vcpu_cpuCount 0
counterBlock_tag 0:2002
parent_dsClass 2
parent_dsIndex 1
counterBlock_tag 0:2000
hostname apache2.service
UUID 92-53-c6-17-60-65-52-a2-ac-f7-76-cb-7b-63-d9-23
machine_type 3
os_name 2
os_release 4.4.0-45-generic
endSample ----------------------
Install Host sFlow agents on all the hosts in the data center for comprehensive visibility.

Using Ganglia to monitor Linux services

Telegraf, InfluxDB, Chronograf, and Kapacitor

The InfluxData TICK (Telegraf, InfluxDB, Chronograf, Kapacitor) provides a full set of integrated metrics tools, including an agent to export metrics (Telegraf), a time series database to collect and store the metrics (InfluxDB), a dashboard to display metrics (Chronograf), and a data processing engine (Kapacitor). Each of the tools is open sourced and can be used together or separately.
This article will show how industry standard sFlow agents embedded within the data center infrastructure can provide Telegraf metrics to InfluxDB. The solution uses sFlow-RT as a proxy to convert sFlow metrics into their Telegraf equivalent form so that they are immediately visible through the default Chronograf dashboards (Using a proxy to feed metrics into Ganglia described a similar approach for sending metrics to Ganglia).

The following telegraf.js script instructs sFlow-RT to periodically export host metrics to InfluxDB:
var influxdb = "http://10.0.0.56:8086/write?db=telegraf";

function sendToInfluxDB(msg) {
if(!msg || !msg.length) return;

var req = {
url:influxdb,
operation:'POST',
headers:{"Content-Type":"text/plain"},
body:msg.join('\n')
};
req.error = function(e) {
logWarning('InfluxDB POST failed, error=' + e);
}
try { httpAsync(req); }
catch(e) {
logWarning('bad request ' + req.url + '' + e);
}
}

var metric_names = [
'host_name',
'load_one',
'load_five',
'load_fifteen',
'cpu_num',
'uptime',
'cpu_user',
'cpu_system',
'cpu_idle',
'cpu_nice',
'cpu_wio',
'cpu_intr',
'cpu_sintr',
'cpu_steal',
'cpu_guest',
'cpu_guest_nice'
];

var ntoi;
function mVal(row,name) {
if(!ntoi) {
ntoi = {};
for(var i = 0; i < metric_names.length; i++) {
ntoi[metric_names[i]] = i;
}
}
return row[ntoi[name]].metricValue;
}

setIntervalHandler(function() {
var i,r,msg = [];
var vals = table('ALL',metric_names);
for(i = 0; i < vals.length; i++) {
r = vals[i];

// Telegraf System plugin metrics
msg.push('system,host='
+mVal(r,'host_name')
+' load1='+mVal(r,'load_one')
+',load5='+mVal(r,'load_five')
+',load15='+mVal(r,'load_fifteen')
+',n_cpus='+mVal(r,'cpu_num')+'i');
msg.push('system,host='
+mVal(r,'host_name')
+' uptime='+mVal(r,'uptime')+'i');

// Telegraf CPU plugin metrics
msg.push('cpu,cpu=cpu-total,host='
+mVal(r,'host_name')
+' usage_user='+(mVal(r,'cpu_user')||0)
+',usage_system='+(mVal(r,'cpu_system')||0)
+',usage_idle='+(mVal(r,'cpu_idle')||0)
+',usage_nice='+(mVal(r,'cpu_nice')||0)
+',usage_iowait='+(mVal(r,'cpu_wio')||0)
+',usage_irq='+(mVal(r,'cpu_intr')||0)
+',usage_softirq='+(mVal(r,'cpu_sintr')||0)
+',usage_steal='+(mVal(r,'cpu_steal')||0)
+',usage_guest='+(mVal(r,'cpu_guest')||0)
+',usage_guest_nice='+(mVal(r,'cpu_guest_nice')||0));
}
sendToInfluxDB(msg);
},15);
Some notes on the script:
  1. The sentToInfluxDB() function uses the Writing data using the HTTP API to POST metrics to InfluxDB.
  2. The setIntervalHandler function retrieves a table of metrics from sFlow-RT every 15 seconds and formats them to use the same names and tags as Telegraf.
  3. The script implements Telegraf System and CPU plugin functionality.
  4. Additional metrics can easily be added to proxy additional Telegraf plugins.
  5. Writing applications provides an overview of the sFlow-RT APIs.
Start gathering metrics:
docker run -v `pwd`/telegraf.js:/sflow-rt/telegraf.js \
-e "RTPROP=-Dscript.file=telegraf.js" \
-p 8008:8008 -p 6343:6343/udp sflow/sflow-rt
Accessing the Chronograf home page brings up a table of hosts with their status and CPU load:
Clicking on the leaf1 host displays a dashboard trending key performance metrics:
Pre-processing the metrics using sFlow-RT's real-time streaming analytics engine can greatly increase scaleability by selectively exporting metrics and calculating higher level summary statistics in order to reduce the amount of data logged to the time series database. The analytics pipeline can also augment the metrics with additional metadata.
For example, Collecting Docker Swarm service metrics demonstrates how sFlow-RT can monitor dynamic service pools running under Docker Swarm and write summary statistics to InfluxDB. In this case Grafana was used to build metrics dashboard instead of Chronograf.

The open source Host sFlow agent exports an extensive range of standard sFlow metrics and has been ported to a wide range of platforms. Standard metrics describes how standardization helps reduce operational complexity. The overlap between standard sFlow metrics and Telegraf base plugin metrics makes the task of proxying straightforward.
The Host sFlow agent (and sFlow agents embedded in network switches and routers) goes beyond simple metrics export to provide detailed visibility into network traffic and articles on this blog demonstrate how sFlow-RT analytics software can be configured to generate detailed traffic flow metrics that can be streamed into InfluxDB, logged (e.g. Exporting events using syslog), or trigger control actions (e.g. DDoS mitigationDocker 1.12 swarm mode elastic load balancing).

QUIC

A QUIC update on Google’s experimental transport describes some of the benefits of  the QUIC (Quick UDP Internet Connections) protocol that is now the default transport when Google's Chrome browser connects to Google services (gmail, search, etc.). Given the over 50% market share of the Chrome browser (NetMarketShare) and the popularity of Google services, it is important to be aware of the QUIC protocol and to start tracking its use of network resources.

An easy way to see if you have any QUIC traffic on your network is to use the standard sFlow instrumentation built into network switches. Configure the switches to send sFlow telemetry to an sFlow collector for visibility into network traffic.

For example, use Docker to run the sFlow-RT active-flows application to analyze the sFlow data stream:
docker run -p 6343:6343/udp -p 8008:8008 -d sflow/top-flows
Access the web interface at http://localhost:8008/ and enter the following Flow Specification to monitor QUICK flows:
dns:ipsource,dns:ipdestination,quicpackettype
Note: Real-time domain name lookups describes how sFlow-RT incorporates DNS (Domain Name Service) requests in its real-time analytics pipeline so that traffic flows can be identified by domain name.

The resulting top flows table is shown in the screen capture above. The Google addresses are identifiable by the 1e100.net domain names (What is 1e100.net?) and it appears that all the traffic is flowing to or from Google services (as one would expect). However, it would be nice to be able to be notified of QUIC traffic that is not associated with Google since this could represent a threat.

The following quic.js script generates events for QUIC traffic to non-Google domains:
setFlow('quic-non-google',{
keys:'dns:ipsource,dns:ipdestination,quicpackettype',
value:'frames',
filter:'!(suffix:[dns:ipsource]:.:3=1e100.net.|suffix:[dns:ipdestination]:.:3=1e100.net.)',
log:true,
flowStart:true
});

setFlowHandler(function(rec) {
logWarning(rec.flowKeys);
},['quic-non-google']);
Note:Writing Applications gives an overview of sFlow-RT's embedded script API. The script logs events.

Run the script using the following command:
docker run -v `pwd`/quic.js:/sflow-rt/quic.js \
-e "RTPROP=-Ddns.servers=resolv.conf -Dscript.file=quic.js" \
-p 8008:8008 -p 6343:6343/udp sflow/top-flows
The article Exporting events using syslog shows how the script could be modified export events via syslog to SIEM tools such as Logstash and Splunk.

Nutanix

Maximum Performance from Acropolis Hypervisor and Open vSwitch describes the network architecture within a Nutanix converged infrastructure appliance - see diagram above. This article will explore how the Host sFlow agent can be deployed to enable sFlow instrumentation in the Open vSwitch (OVS)  and deliver streaming network and system telemetry from nodes in a Nutanix cluster.
This article is based on a single hardware node running Nutanix Community Edition (CE), built following the instruction in Part I: How to setup a three-node NUC Nutanix CE cluster. If you don't have hardware readily available, the article, 6 Nested Virtualization Resources To Get You Started With Community Edition, describes how to run Nutanix CE as a virtual machine.
The sFlow standard is widely supported by network equipment vendors, which combined with sFlow from each Nutanix appliance, delivers end to end visibility in the Nutanix cluster. The following screen captures from the free sFlowTrend tool are representative examples of the data available from the Nutanix appliance.
The Network > Top N chart displays the top flows traversing OVS. In this case an HTTP connection is responsible for most of the traffic. Inter-VM and external traffic flows traverse OVS and are efficiently monitored by the embedded sFlow instrumentation.
The Hosts > CPU utilization chart shows an increase in CPU utilization due to the increased traffic.
The Hosts > Disk IO shows the Write operations associated with connection.

Installing Host sFlow agent on Nutanix appliance

The following steps install Host sFlow on a Nutanix device:

First log into the Nutanix host as root.

Next, find the latest version of the Centos 7 RPM on sFlow.net and use the following commands to download and install the software:
wget https://github.com/sflow/host-sflow/releases/download/v2.0.8-1/hsflowd-centos7-2.0.8-1.x86_64.rpm
rpm -ivh hsflowd-centos7-2.0.8-1.x86_64.rpm
rm hsflowd-centos7-2.0.8-1.x86_64.rpm
Edit the /etc/hsflowd.conf file to direct sFlow telemetry to collector 10.0.0.50, enable KVM monitoring (virtual machine stats), and push sFlow configuration to OVS (network stats):
sflow {
...
# collectors:
collector { ip=10.0.0.50 udpport=6343 }
...
# Open vSwitch sFlow configuration:
ovs { }
# KVM (libvirt) hypervisor and VM monitoring:
kvm { }
...
}
Now start the Host sFlow daemon:
systemctl enable hsflowd.service
systemctl start hsflowd.service
Data will immediately start to appear in sFlowTrend.

Arista EOS telemetry

Arista EOS switches support industry standard sFlow telemetry, enabling hardware instrumentation supported by merchant silicon to export hardware interface counters and flow data. The latest release of the open source Host sFlow agent has been ported to EOS, augmenting the telemetry with standard host CPU, memory, and disk IO metrics.

Linux as a Switch Operating System: Five Lessons Learned identifies benefits of using Linux as the basis for EOS. In this context, the Linux operating system made it easy to port the Host sFlow agent, use standard Linux package management (RPM Package Manager), and gather metrics using standard Linux APIs. A new eAPI module automatically synchronizes the Host sFlow daemon with the EOS sFlow configuration.

The following sflowtool output shows the additional metrics contributed by a Host sFlow agent installed on an Arista switch:
startDatagram =================================
datagramSourceIP 172.17.0.1
datagramSize 704
unixSecondsUTC 1490843418
datagramVersion 5
agentSubId 100000
agent 10.0.0.90
packetSequenceNo 714
sysUpTime 0
samplesInPacket 1
startSample ----------------------
sampleType_tag 0:2
sampleType COUNTERSSAMPLE
sampleSequenceNo 714
sourceId 2:1
counterBlock_tag 0:2001
counterBlock_tag 0:2010
udpInDatagrams 1459
udpNoPorts 16
udpInErrors 0
udpOutDatagrams 4765
udpRcvbufErrors 0
udpSndbufErrors 0
udpInCsumErrors 0
counterBlock_tag 0:2009
tcpRtoAlgorithm 1
tcpRtoMin 200
tcpRtoMax 120000
tcpMaxConn 4294967295
tcpActiveOpens 102
tcpPassiveOpens 100
tcpAttemptFails 0
tcpEstabResets 0
tcpCurrEstab 8
tcpInSegs 19930
tcpOutSegs 19804
tcpRetransSegs 0
tcpInErrs 0
tcpOutRsts 2
tcpInCsumErrors 0
counterBlock_tag 0:2008
icmpInMsgs 1606
icmpInErrors 0
icmpInDestUnreachs 16
icmpInTimeExcds 0
icmpInParamProbs 0
icmpInSrcQuenchs 0
icmpInRedirects 0
icmpInEchos 1590
icmpInEchoReps 0
icmpInTimestamps 0
icmpInAddrMasks 0
icmpInAddrMaskReps 0
icmpOutMsgs 0
icmpOutErrors 1606
icmpOutDestUnreachs 0
icmpOutTimeExcds 16
icmpOutParamProbs 0
icmpOutSrcQuenchs 0
icmpOutRedirects 0
icmpOutEchos 0
icmpOutEchoReps 0
icmpOutTimestamps 1590
icmpOutTimestampReps 0
icmpOutAddrMasks 0
icmpOutAddrMaskReps 0
counterBlock_tag 0:2007
ipForwarding 2
ipDefaultTTL 64
ipInReceives 24685
ipInHdrErrors 0
ipInAddrErrors 42
ipForwDatagrams 0
ipInUnknownProtos 0
ipInDiscards 0
ipInDelivers 23025
ipOutRequests 26170
ipOutDiscards 0
ipOutNoRoutes 0
ipReasmTimeout 0
ipReasmReqds 0
ipReasmOKs 0
ipReasmFails 0
ipFragOKs 4
ipFragFails 0
ipFragCreates 8
counterBlock_tag 0:2005
disk_total 1907843072
disk_free 1083969536
disk_partition_max_used 43.18
disk_reads 16549
disk_bytes_read 1337825280
disk_read_time 7420
disk_writes 412
disk_bytes_written 1159168
disk_write_time 216
counterBlock_tag 0:2004
mem_total 1938849792
mem_free 85483520
mem_shared 0
mem_buffers 106614784
mem_cached 735801344
swap_total 0
swap_free 0
page_in 830716
page_out 566
swap_in 0
swap_out 0
counterBlock_tag 0:2003
cpu_load_one 0.070
cpu_load_five 0.060
cpu_load_fifteen 0.050
cpu_proc_run 0
cpu_proc_total 221
cpu_num 1
cpu_speed 2698
cpu_uptime 17265
cpu_user 272510
cpu_nice 50
cpu_system 178050
cpu_idle 16279880
cpu_wio 550
cpuintr 461060
cpu_sintr 41840
cpuinterrupts 5458397
cpu_contexts 5338141
cpu_steal 0
cpu_guest 0
cpu_guest_nice 0
counterBlock_tag 0:2006
nio_bytes_in 8149749
nio_pkts_in 115730
nio_errs_in 0
nio_drops_in 0
nio_bytes_out 4996846
nio_pkts_out 28451
nio_errs_out 0
nio_drops_out 0
counterBlock_tag 0:2000
hostname leaf1
UUID 33-28-66-a5-82-27-43-49-a5-f1-c1-ba-cc-6c-1d-d3
machine_type 2
os_name 2
os_release 3.4.43.Ar-4170906.4180F
endSample ----------------------
endDatagram =================================
There are a number of additional open source and commercial sFlow collectors available.
For example, the diagram shows how new and existing cloud based or locally hosted orchestration, operations, and security tools can leverage the sFlow-RT analytics service to gain real-time visibility.

Installing Host sFlow agent on an Arista switch

The following steps download and install the Host sFlow agent on an Arista switch and direct the telemetry stream to collector 10.0.0.50:

1. Install the Host sFlow agent (hsflowd)
eos# copy https://github.com/sflow/host-sflow/releases/download/v2.0.9-1/hsflowd-eos-2.0.9-1.x86_64.rpm extension:
eos# extension hsflowd-eos-2.0.9-1.x86_64.rpm
eos# bash sudo systemctl start hsflowd.service
eos# copy installed-extensions boot-extensions
2. Enable eAPI, see eAPI and Unix Domain Socket
eos(config)# management api http-commands
eos(config-mgmt-api-http-cmds)# protocol unix-socket
eos(config-mgmt-api-http-cmds)# no shutdown
3. Configure switch to run hsflowd on startup:
eos(config)# event-handler hsflowd
eos(config-handler-hsflowd)# trigger on-boot
eos(config-handler-hsflowd)# action bash sudo systemctl start hsflowd.service
eos(config-handler-hsflowd)# delay 60
eos(config-handler-hsflowd)# asynchronous
4. Configure sFlow Introduction to Managing EOS Devices – Setting up Management
eos(config)# sflow source-interface Management1
eos(config)# sflow destination 10.0.0.50
eos(config)# sflow run
The host metrics should immediately begin to be received at the sFlow collector.

Remotely Triggered Black Hole (RTBH) Routing

The screen shot demonstrates real-time distributed denial of service (DDoS) mitigation. Automatic mitigation was disabled for the first simulated attack (shown on the left of the chart).  The attack reaches a sustained packet rate of 1000 packets per second for a period of 60 seconds. Next, automatic mitigation was enabled and a second attack launched. This time, as soon as the traffic crosses the threshold (the horizontal red line), a BGP remote trigger message is sent to router, which immediately drops the traffic.
The diagram shows the test setup. The network was built out of freely available components: CumulusVX switches and Ubuntu 16.04 servers running under VirtualBox.

The following configuration is installed on the ce-router:
router bgp 65141
bgp router-id 0.0.0.141
neighbor 10.0.0.70 remote-as 65140
neighbor 10.0.0.70 port 1179
neighbor 172.16.141.2 remote-as 65141
!
address-family ipv4 unicast
neighbor 10.0.0.70 allowas-in
neighbor 10.0.0.70 route-map blackhole-in in
exit-address-family
!
ip community-list standard blackhole permit 65535:666
!
route-map blackhole-in permit 20
match community blackhole
match ip address prefix-len 32
set ip next-hop 192.0.2.1
The ce-router peers with the upstream service provider router (sp-router 172.16.141.2) as well as with sFlow-RT.  A route-map is used to filter updates from sFlow-RT (10.0.0.70), matching the well-known blackhole community 65535:666, and setting the null route next-hop 192.0.2.1. The route-map also ensures that only /32 prefixes are accepted. In production, the route-map should also filter out the addresses of critical infrastructure (router IP addresses etc.).

An additional route-map will typically be required to select the blackhole routes to propagate upstream, re-mapping the community to meet the upstream service provider's policy, e.g. Hurricane Electric uses community 6939:666.

In addition, the ce-router is configured to send sFlow to the controller (10.0.0.70), see Switch configurations.

Run the DDoS mitigation application on server 10.0.0.70 using docker:
docker run --net=host -p 6343:6343/udp -p 8008:8008 -p 1179:1179 -e "RTPROP=-Dddos_blackhole.router=10.0.0.140 -Dddos_blackhole.as=65141" sflow/ddos-blackhole
Alternatively, an RPM or DEB packaged version of sFlow-RT can be downloaded and installed on the server and the ddos-blackhole application can be installed. For example, on Ubuntu:
wget http://www.inmon.com/products/sFlow-RT/sflow-rt_2.0-1195.deb
dpkg -i sflow-rt_2.0-1195.deb
/usr/local/sflow-rt/get-app.sh sflow-rt ddos-blackhole
Edit the configuration file, /usr/local/sflow-rt/conf.d/sflow-rt.conf:
bgp.start=yes
ddos_blackhole.router=10.0.0.140
ddos_blackhole.as=65141
Next, start the daemon:
service sflow-rt start
In either case, the remainder of the configuration is handled through the web interface, accessible via http://10.0.0.70:8008/

Click on the Settings tab and upload the following IP Address Groups file groups.json:
{
"external": [
"0.0.0.0/0"
],
"private": [
"10.0.0.0/8",
"192.168.0.0/16"
],
"multicast": [
"224.0.0.0/4"
],
"exclude":
"172.16.0.0/12"
"web": [
"172.16.140.0/24"
]
}
The groups identify addresses that are external (possible attackers) and local (possible targets). By default, traffic to the externalprivate, multicast and exclude groups will not trigger actions. Any additional group names, in this case web, are blackhole candidates.

Note: Only traffic from the external group to backhole candidate groups (web) is shown on the Charts tab (and considered for DDoS detection and mitigation).

The following command on sp-host simulates an ICMP flood attack on ce-host:
ping -f 172.16.140.1
The following messages should appear in the sFlow-RT logs:
2017-06-17T00:17:39+0000 INFO: Listening, BGP port 1179
2017-06-17T00:17:40+0000 INFO: Listening, sFlow port 6343
2017-06-17T00:17:40+0000 INFO: Listening, HTTP port 8008
2017-06-17T00:17:40+0000 INFO: app/ddos-blackhole/scripts/ddos.js started
2017-06-17T00:17:40+0000 INFO: app/ddos-blackhole/scripts/stats.js started
2017-06-17T00:17:46+0000 INFO: BGP open 10.0.0.140 41692
2017-06-17T00:18:13+0000 INFO: DDoS blocking 172.16.140.1
2017-06-17T00:20:25+0000 INFO: DDoS allowing 172.16.140.1
The screen capture at the top of this article shows that the time between the attack being launched and successfully blocked is just a few of seconds.

BGP FlowSpec on white box switch

BGP FlowSpec is a method of distributing access control lists (ACLs) using the BGP protocol. Distributed denial of service (DDoS) mitigation is an important use case for the technology, allowing a targeted network to push filters to their upstream provider to selectively remove the attack traffic.

Unfortunately, FlowSpec is currently only available on high end routing devices and so experimenting with the technology is expensive. Looking for an alternative, Cumulus Linux is an open Linux platform that allows users to install Linux packages and develop their own software.

This article describes a proof of concept implementation of basic FlowSpec functionality using ExaBGP installed on a free Cumulus VX virtual machine.  The same solution can be run on inexpensive commodity white box hardware to deliver terabit traffic filtering in a production network.

First, install latest version of ExaBGP on the Cumulus Linux switch:
curl -L https://github.com/Exa-Networks/exabgp/archive/4.0.0.tar.gz | tar zx
Now define the handler, acl.py, that will convert BGP FlowSpec updates into standard Linux netfilter/iptables entries used by Cumulus Linux to specify hardware ACLs (see Netfilter - ACLs):
#!/usr/bin/python

import json
import re
from os import listdir,remove
from os.path import isfile
from subprocess import Popen,STDOUT,PIPE
from sys import stdin, stdout, stderr

id = 0
acls = {}

dir = '/etc/cumulus/acl/policy.d/'
priority = '60'
prefix = 'flowspec'
bld = '.bld'
suffix = '.rules'

def commit():
Popen(["cl-acltool","-i"],stderr=STDOUT,stdout=PIPE).communicate()[0]

def aclfile(name):
global dir,priority,prefix,suffix
return dir+priority+prefix+name+suffix

def handleSession(state):
if "down" == state:
for key,rec in acls.items():
fn = aclfile(str(rec['id']))
if isfile(fn):
remove(fn)
del acls[key]
commit()

def buildACL(flow,action):
acl = "[iptables]\n-A FORWARD --in-interface swp+"
if flow.get('protocol'):
acl = acl + " -p " + re.sub('[!<>=]','',flow['protocol'][0])
if flow.get('source-ipv4'):
acl = acl + " -s " + flow['source-ipv4'][0]
if flow.get('destination-ipv4'):
acl = acl + " -d " + flow['destination-ipv4'][0]
if flow.get('source-port'):
acl = acl + " --sport " + re.sub('[!<>=]','',flow['source-port'][0])
if flow.get('destination-port'):
acl = acl + " --dport " + re.sub('[!<>=]','',flow['destination-port'][0])
acl = acl + " -j DROP\n"
return acl

def handleFlow(add,flow,action):
global id
key = flow['string']
if add:
acl = buildACL(flow,action)
id = id + 1
acls[key] = {"acl":acl,"id":id}
fn = aclfile(str(id))
f = open(fn,'w')
f.write(acl)
f.close()
commit()
elif key in acls:
rec = acls[key]
fn = aclfile(str(rec['id']))
if isfile(fn):
remove(fn)
del acls[key]
commit()

while True:
try:
line = stdin.readline().strip()
msg = json.loads(line)
type = msg["type"]
if "state" == type:
state = msg["neighbor"]["state"]
handleSession(state)
elif "update" == type:
update = msg["neighbor"]["message"]["update"]
if update.get('announce'):
flow = update["announce"]["ipv4 flow"]["no-nexthop"][0]
community = update["attribute"]["extended-community"][0]
handleFlow(True,flow,community)
elif update.get('withdraw'):
flow = update["withdraw"]["ipv4 flow"][0]
handleFlow(False,flow,None)
else:
pass
except IOError:
pass
Note: This script is a simple demonstration of the concept that has significant limitations: there is no error handling, the only action is to drop traffic, and FlowSpec comparison operators are ignored. The script is is based on the article RESTful control of Cumulus Linux ACLs.

Next, create the exabgp.conf file:
process acl {
run ./acl.py;
encoder json;
}

template {
neighbor controller {
family {
ipv4 flow;
}
api speaking {
processes [ acl ];
neighbor-changes;
receive {
parsed;
update;
}
}
}
}

neighbor 10.0.0.70 {
inherit controller;
router-id 10.0.0.140;
local-as 65140;
peer-as 65070;
local-address 0.0.0.0;
connect 1179;
}
Finally, run ExaBGP:
sudo env exabgp.daemon.user=root exabgp-4.0.0/sbin/exabgp exabgp.conf
This configuration instructs ExaBGP to connect to the controller, 10.0.0.162, and prepare to receive BGP FlowSpec messages. When a BGP message is received, ExaBGP decodes the message and passes it on in the form of a JSON encoded string to the acl.py program. For example, the following FlowSpec message was sent to block an NTP reflection DDoS attack (traffic from UDP port 123) targeting host 192.168.0.1:
{
"exabgp": "4.0.0",
"time": 1498868955.31,
"host": "tor-router",
"pid": 3854,
"ppid": 3849,
"counter": 6,
"type": "update",
"neighbor": {
"address": {
"local": "0.0.0.0",
"peer": "10.0.0.70"
},
"asn": {
"local": "65140",
"peer": "65070"
},
"direction": "receive",
"message": {
"update": {
"attribute": {
"origin": "igp",
"as-path": [
65140
],
"confederation-path": [],
"local-preference": 100,
"extended-community": [
9225060886715040000
]
},
"announce": {
"ipv4 flow": {
"no-nexthop": [
{
"destination-ipv4": [
"192.168.0.1/32"
],
"protocol": [
"=udp"
],
"source-port": [
"=123"
],
"string": "flow destination-ipv4 192.168.0.1/32 protocol =udp source-port =123"
}
]
}
}
}
}
}
}
The acl.py script wrote the file /etc/cumulus/acl/policy.d/60flowspec1.rules with an iptables representation of the FlowSpec message:
[iptables]
-A FORWARD --in-interface swp+ -p udp -d 192.168.0.1/32 --sport 123 -j DROP
The acl.py script also invoked the cl-acltool command to install the new rule, which can be verified using iptables:
sudo iptables --list FORWARD
Chain FORWARD (policy ACCEPT)
target prot opt source destination
DROP all -- 240.0.0.0/5 anywhere
DROP all -- loopback/8 anywhere
DROP all -- base-address.mcast.net/4 anywhere
DROP all -- 255.255.255.255 anywhere
DROP udp -- anywhere 192.168.0.1 udp spt:ntp
The attack traffic is now dropped by the switch. In a hardware switch, this entry would be pushed by Cumulus Linux into the hardware, filtering the traffic at line rate to provide Terabit traffic filtering.

Real-time DDoS mitigation using sFlow and BGP FlowSpec

Remotely Triggered Black Hole (RTBH) Routing describes how native BGP support in the sFlow-RT real-time sFlow analytics engine can be used to blackhole traffic in order to mitigate a distributed denial of service (DDoS) attack. Black hole routing is effective, but there is significant potential for collateral damage since ALL traffic to the IP address targeted by the attack is dropped.

The BGP FlowSpec extension (RFC 5575: Dissemination of Flow Specification Rules) provides a method of transmitting traffic filters that selectively block the attack traffic while allowing normal traffic to pass. BGP FlowSpec support has recently been added to sFlow-RT and this article demonstrates the new capability.

This demonstration uses the test network described in Remotely Triggered Black Hole (RTBH) Routing. The network was constructed using free components: VirtualBox, Cumulus VX, and Ubuntu LinuxBGP FlowSpec on white box switch describes how to implement basic FlowSpec support on Cumulus Linux.

The following flowspec.js sFlow-RT script detects and blocks UDP-Based Amplification attacks:
var router = '10.0.0.141';
var id = '10.0.0.70';
var as = 65141;
var thresh = 1000;
var block_minutes = 1;

setFlow('udp_target',{keys:'ipdestination,udpsourceport',value:'frames'});

setThreshold('attack',{metric:'udp_target', value:thresh, byFlow:true});

bgpAddNeighbor(router,as,id,{flowspec:true});

var controls = {};
setEventHandler(function(evt) {
var key = evt.flowKey;
if(controls[key]) return;

var now = (new Date()).getTime();
var [ip,port] = key.split(',');
var flow = {
'match':{
'protocol':'=17',
'source-port':'='+port,
'destination': ip
},
'then': {'traffic-rate':0}
};
controls[key] = {time:now, target: ip, port: port, flow:flow};
bgpAddFlow(router, flow);
logInfo('block target='+ip+' port='+port);
},['attack']);

setIntervalHandler(function() {
var now = (new Date()).getTime();
for(var key in controls) {
if(now - controls[key].time < 1000 * 60 * block_minutes) continue;
var control = controls[key];
delete controls[key];
bgpRemoveFlow(router,control.flow);
logInfo('allow target='+control.target+' port='+control.port);
}
});
See Writing Applications for more information on sFlow-RT scripting and APIs.

Start sFlow-RT:
env "RTPROP=-Dscript.file=flowspec.js -Dbgp.start=yes" ./start.sh
Simulate a DNS amplification attack using hping:
sudo hping3 --flood --udp -k -s 53 172.16.140.1
The screen capture shows the results. The left of the chart shows a simulated attack without mitigation. The attack reaches a sustained rate 30,000 packets per seconds. The right half of the chart shows an attack with automatic mitigation enabled. The target IP address and UDP source port associated with the amplification attack are immediately identified and a BGP FlowSpec filter is pushed to the upstream service provider router, sp-router, where the attack traffic is immediately dropped.

Arista eAPI

The sFlow and eAPI features of EOS (Extensible Operating System) are standard across the full range of Arista Networks switches. This article demonstrates how the real-time visibility provided by sFlow telemetry can be combined with the programmatic control of eAPI to automatically adapt the network to changing traffic conditions.

In the diagram, the sFlow-RT analytics engine receives streaming sFlow telemetry, provides real-time network-wide visibility, and automatically applies controls using eAPI to optimize forwarding, block denial of service attacks, or capture suspicious traffic.

Arista eAPI 101 describes the JSON RPC interface for programmatic control of Arista switches. The following eapi.js script shows how eAPI requests can be made using sFlow-RT's JavaScript API:
function runCmds(proto, agent, usr, pwd, cmds) {
var req = {
jsonrpc:'2.0',id:'sflowrt',method:'runCmds',
params:{version:1,cmds:cmds,format:'json'}
};
var url = (proto || 'http')+'://'+agent+'/command-api';
var resp = http(url,'post','application/json',JSON.stringify(req),usr,pwd);
if(!resp) throw "no response";
resp = JSON.parse(resp);
if(resp.error) throw resp.error.message;
return resp.result;
}
The following test.js script demonstrates the eAPI functionality with a basic show request:
include('eapi.js');
var result = runCmds('http','10.0.0.90','admin','arista',['show hostname']);
logInfo(JSON.stringify(result));
Starting sFlow-RT:
env "RTPROP=-Dscript.file=test.js" ./start.sh
Running the script generates the following output:
2017-07-10T14:00:06-0700 INFO: Listening, sFlow port 6343
2017-07-10T14:00:06-0700 INFO: Listening, HTTP port 8008
2017-07-10T14:00:06-0700 INFO: test.js started
2017-07-10T14:00:06-0700 INFO: [{"fqdn":"leaf1","hostname":"leaf1"}]
2017-07-10T14:00:06-0700 INFO: test.js stopped
While retrieving information from the switch is useful, reconfiguring the switch based on real-time sFlow telemetry is much more interesting.

DDoS describes how sFlow analytics can be used to detect distributed denial of service (DDoS) attacks in real-time. EOS DirectFlow provides a flexible method of applying traffic controls and the following ddos.js script automatically detects UDP reflection/amplification attacks and uses eAPI to install DirectFlow entries to drop the attack traffic:
include('eapi.js');

var proto = 'http';
var user = 'admin';
var password = 'arista';
var thresh = 1000000;
var block_minutes = 60;

setFlow('udp_target',{keys:'ipdestination,udpsourceport',value:'frames'});

setThreshold('attack',{metric:'udp_target', value:thresh, byFlow:true});

var controls = {};
var id = 0;
setEventHandler(function(evt) {
var key = evt.agent + ',' + evt.flowKey;
if(controls[key]) return;

var now = (new Date()).getTime();
var flow = 'ddos'+id++;
var [ip,port] = evt.flowKey.split(',');
var cmds = [
'enable',
'configure',
'directflow',
'flow ' + flow,
'match ethertype ip',
'match destination ip ' + ip,
'match ip protocol udp',
'match source port ' + port,
'action drop'
];
controls[key] = {time:now, target: ip, port: port, agent:evt.agent, flow:flow};
try { runCmds(proto,evt.agent,user,password,cmds); }
catch(e) { logSevere('failed to add filter, ' + e); }
logInfo('block target='+ip+' port='+port+' agent=' + evt.agent);
},['attack']);

setIntervalHandler(function() {
var now = (new Date()).getTime();
for(var key in controls) {
if(now - controls[key].time < 1000 * 60 * block_minutes) continue;
var ctl = controls[key];
delete controls[key];
var cmds = [
'enable',
'configure',
'directflow',
'no flow ' + ctl.flow
];
try { runCmds(proto,ctl.agent,user,password,cmds); }
catch(e) { logSevere('failed to remove filter, ' + e); }
logInfo('allow target='+ctl.target+' port='+ctl.port+' agent='+ctl.agent);
}
});
Some notes on the script:
  • The script is designed to work with a large number of switches, automatically applying the DirectFlow filter to the switch reporting the traffic.
  • The udp_target flow identifies the IP address targeted by the attack and the UDP source port of service being used to reflect/amplify traffic. 
  • A threshold of 1,000,000 frames per second is used to trigger an event.
  • The setEventHandler function extracts target IP address, and UDP source port from the event and uses eAPI to push a DirectFlow filter to switch (agent) identified in the event.
  • The setIntervalHandler function is responsible for removing controls after 60 minutes.
  • The script can easily be modified to use eAPI to gather additional metadata. For example, to identify leaf switches and limit filters to the edge of the network.
  • Exporting events using syslog shows how notifications can be sent to SIEM tools, e.g. Splunk, Logstash, etc.
  • InfluxDB and Grafana, Metric export to Graphite, Cloud analytics, and SignalFx, demonstrate how metrics can be pushed to local and/or cloud-based dashboards.
  • See Writing Applications for more information on sFlow-RT scripting and APIs.
The basic steps of defining a flow, setting a threshold, and then acting on events embodied in this example provide a general framework that can be applied to a wide variety of use cases: SDN and large flows, Marking large flows, SDN packet broker etc. In addition to DirectFlow, other useful EOS eAPI controls include: ACLs, route maps, static routes, null routes, packet capture etc.

Industry standard sFlow telemetry unlocks the full potential of programmable networking platforms such as Arista EOS, providing the visibility required to automatically target controls and adapt the network in real-time to changing network conditions to increase performance, reduce cost, and improve security.

Linux 4.11 kernel extends packet sampling support

Linux 4.11 on Linux Kernel Newbies describes the features added in the April 30, 2017 release. Of particular interest is the new netlink sampling channel:
Introduce psample, a general way for kernel modules to sample packets, without being tied to any specific subsystem. This netlink channel can be used by tc, iptables, etc. and allow to standardize packet sampling in the kernel commit
The psample netlink channel delivers sampled packet headers along with associated metadata from the Linux kernel to user space. The psample fields map directly into sFlow Version 5 sampled_header export structures:

netlink psamplesFlowDescription
PSAMPLE_ATTR_IIFINDEXinputInterface packet was received on.
PSAMPLE_ATTR_OIFINDEXoutputInterface packet was sent on.
PSAMPLE_ATTR_GROUP_SEQdropsNumber of times that the sFlow agent detected that a packet marked to be sampled was dropped due to lack of resources. Agent calculates drops by tracking discontinuities in PSAMPLE_ATTR_GROUP_SEQ
PSAMPLE_ATTR_SAMPLE_RATEsampling_rateThe Sampling Rate specifies the ratio of packets observed at the Data Source to the samples generated. For example a sampling rate of 100 specifies that, on average, 1 sample will be generated for every 100 packets observed.
PSAMPLE_ATTR_ORIGSIZEframe_lengthOriginal length of packet before sampling
PSAMPLE_ATTR_DATAheader<>Header bytes

Linux is widely used for switch network operating systems, including: Arista EOS, Cumulus Linux, Dell OS10, OpenSwitch, SONiC, and Open Network Linux. The adoption of Linux by network vendors and cloud providers is driving increased support for switch hardware by the Linux kernel community.

Hardware support for sFlow packet sampling is widely implemented in switch ASICs, including: Broadcom, Mellanox, Intel, Marvell, Barefoot Networks, Cavium, and Innovium. A standard Linux interface to ASIC sampling simplifies the implementation of sFlow agents (e.g. Host sFlow) and ensures consistent behavior across hardware platforms to deliver real-time network-wide visibility using industry standard sFlow protocol.

Cumulus Linux 3.4 REST API

The latest Cumulus Linux 3.4 release include a REST API. This article will demonstrate how the REST API can be used to automatically deploy traffic controls based on real-time sFlow telemetry. DDoS mitigation with Cumulus Linux describes how sFlow-RT can detect Distributed Denial of Service (DDoS) attacks in real-time and deploy automated controls.

The following ddos.js script is modified to use the REST API to send Network Command Line Utility - NCLU commands to add and remove ACLs, see Installing and Managing ACL Rules with NCLU:
var user = "cumulus";
var password = "CumulusLinux!";
var thresh = 10000;
var block_minutes = 1;

setFlow('udp_target',{keys:'ipdestination,udpsourceport',value:'frames'});

setThreshold('attack',{metric:'udp_target', value:thresh, byFlow:true, timeout:10});

function restCmds(agent,cmds) {
for(var i = 0; i < cmds.length; i++) {
let msg = {cmd:cmds[i]};
http("https://"+agent+":8080/nclu/v1/rpc",
"post","application/json",JSON.stringify(msg),user,password);
}
}

var controls = {};
var id = 0;
setEventHandler(function(evt) {
var key = evt.agent + ',' + evt.flowKey;
if(controls[key]) return;

var ifname = metric(evt.agent,evt.dataSource+".ifname")[0].metricValue;
if(!ifname) return;

var now = (new Date()).getTime();
var name = 'ddos'+id++;
var [ip,port] = evt.flowKey.split(',');
var cmds = [
'add acl ipv4 '+name+' drop udp source-ip any source-port '+port+' dest-ip '+ip+' dest-port any',
'add int '+ifname+' acl ipv4 '+name+' inbound',
'commit'

];
controls[key] = {time:now, target: ip, port: port, agent:evt.agent, metric:evt.dataSource+'.'+evt.metric, key:evt.flowKey, name:name};
try { restCmds(evt.agent, cmds); }
catch(e) { logSevere('failed to add ACL, '+e); }
logInfo('block target='+ip+' port='+port+' agent=' + evt.agent);
},['attack']);

setIntervalHandler(function() {
var now = (new Date()).getTime();
for(var key in controls) {
if(now - controls[key].time < 1000 * 60 * block_minutes) continue;
var ctl = controls[key];
if(thresholdTriggered('attack',ctl.agent,ctl.metric,ctl.key)) continue;

delete controls[key];
var cmds = [
'del acl ipv4 '+ctl.name,
'commit'

];
try { restCmds(ctl.agent,cmds); }
catch(e) { logSevere('failed to remove ACL, ' + e); }
logInfo('allow target='+ctl.target+' port='+ctl.port+' agent='+ctl.agent);
}
});
The quickest way test the script is to use docker to run sFlow-RT:
docker run -v $PWD/ddos.js:/sflow-rt/ddos.js \
-e "RTPROP=-Dscript.file=ddos.js -Dhttp.timeout.read=60000" \
-p 6343:6343/udp -p 8008:8008 sflow/sflow-rt
This solution can be tested using freely available software. The setup shown at the top of this article was constructed using a Cumulus VX virtual machine running on VirtualBox.  The Attacker and Target virtual machines are Linux virtual machines used to simulate the DDoS attack.

DNS amplification attack can be simulated using hping3. Run the following command on the Attacker host:
sudo hping3 --flood --udp -k -s 53 192.168.2.1
Run tcpdump on the Target host to see if the attack is getting through:
sudo tcpdump -i eth1 udp port 53
Each time an attack is launched a new ACL will be added that matches the attack signature and drops the traffic. The ACL is kept in place for at least block_minutes and removed once the attack ends. The following sFlow-RT log messages show the results:
2017-08-26T17:01:24+0000 INFO: Listening, sFlow port 6343
2017-08-26T17:01:24+0000 INFO: Listening, HTTP port 8008
2017-08-26T17:01:24+0000 INFO: ddos.js started
2017-08-26T17:03:07+0000 INFO: block target=192.168.2.1 port=53 agent=10.0.0.61
2017-08-26T17:03:49+0000 INFO: allow target=192.168.2.1 port=53 agent=10.0.0.61
REST API for Cumulus Linux ACLs describes the acl_server daemon that was used in the original article. The acl_server daemon is optimized for real-time performance, supporting use cases in which multiple traffic controls need to be quickly added and removed, e.g  DDoS mitigation, marking large flows, ECMP load balancing, packet brokers.

A key benefit of the openness of Cumulus Linux is that you can install software to suite your use case, other examples include: BGP FlowSpec on white box switchInternet router using Cumulus LinuxTopology discovery with Cumulus LinuxBlack hole detection, and Docker networking with IPVLAN and Cumulus Linux.

Troubleshooting connectivity problems in leaf and spine fabrics

Introducing data center fabric, the next-generation Facebook data center network describes the benefits of moving to a leaf and spine network architecture. The diagram shows how the leaf and spine architecture creates many paths between each pair of hosts. Multiple paths increase available bandwidth and resilience against the loss of a link or a switch. While most networks don't have the scale requirements of Facebook, smaller scale leaf and spine designs deliver high bandwidth, low latency, networking to support cloud workloads (e.g. vSphere, OpenStack, Docker, Hadoop, etc.).

Unlike traditional hierarchical network designs, where a small number of links can be monitored to provide visibility, a leaf and spine network has no special links or switches where running CLI commands or attaching a probe would provide visibility. Even if it were possible to attach probes, the effective bandwidth of a leaf and spine network can be as high as a Petabit/second, well beyond the capabilities of current generation monitoring tools.

Fortunately, industry standard sFlow monitoring technology is built into the commodity switch hardware used to build leaf and spine networks. Enabling sFlow telemetry on all the switches in the network provides centralized, real-time, visibility into network traffic.
Fabric View describes an open source application running on the sFlow-RT real-time analytics engine. The Fabric View application provides an overview of the health of the entire leaf and spine fabric, tracking flows and counters on all links and summarizing information in a set of fabric level metrics and dashboards. In addition, Black hole detection describes how to detect routing anomalies in the fabric using the forwarding information included in the sFlow telemetry stream.

The sFlow sampling mechanism implemented in the switches is a highly scaleable method of passively collecting traffic information. However,  analyzing failed connections can be a challenge since very few packets are generated and the chance of sampling these packets is small. The traditional tools used to diagnose connectivity issues, ping and traceroute, are of limited value in a leaf and spine network since they only test a single path and are likely to miss the path that is experiencing difficulties.

An alternative method of addressing the multi-path tracing problem is to enable filtered packet capture on each switch, programming the filters to capture the packets of interest. However, this method can be slow and complex since every switch needs to be configured for each test and the switch configurations need to be cleared after the test has been completed.

This article explores how the hping3 tool can be used with sFlow to trace packet paths across the fabric and detect where they are being lost. The following Python script, trace.py, uses sFlow-RT's REST API to program a flow to watch for a specific flow and print the links that it traverses:
#!/usr/bin/env python
import argparse
import requests
import json
import signal
from random import randint

def sig_handler(signal,frame):
requests.delete(rt+'/flow/'+name+'/json')
exit(0)
signal.signal(signal.SIGINT, sig_handler)

parser = argparse.ArgumentParser()
parser.add_argument('filter', help='sFlow-RT flow filter, e.g. "ipsource=10.0.0.1"')
args = parser.parse_args()

rt = 'http://localhost:8008'
name = 'trace' + str(randint(0,10000))

flow = {'keys':'link:inputifindex','value':'frames',
'filter':args.filter,'log':True,'flowStart':True}
requests.put(rt+'/flow/'+name+'/json',data=json.dumps(flow))

flowurl = rt+'/flows/json?maxFlows=100&timeout=60&name='+name
flowID = -1
while 1 == 1:
r = requests.get(flowurl+'&flowID='+str(flowID))
if r.status_code != 200: break
flows = r.json()
if len(flows) == 0: continue

flowID = flows[0]["flowID"]
flows.reverse()
for f in flows:
print f['flowKeys']
Note: See RESTflow for a description of the sFlow-RT REST API.

First run the following Python script, supplying a filter to select the packets of interest:
./trace.py 'ipsource=172.16.134.1&udpsourceport=1111&ipdestination=172.16.135.1&udpdestinationport=53'
Note: Identifying characteristics of failed connections may be inferable from application error logs. Otherwise, running packet capture on the affected host (tcpdump/wireshark) can identify the network attributes of interest.

Next, log into the host that is having connectivity problems and generate traffic matching the flow:
sudo hping3 -c 100000 -i u100 --udp -k -s 1111 -p 53 172.16.135.1
Note: The above command sends 100,000 packets at a rate of 1 packet every 100 microseconds (i.e. at a rate of 10,000 packets per second).  Select a packet rate that will not disturb production traffic on the network and make sure to send enough packets so that at least one packet will be sampled on each link. For example, for 10G links the packet sampling rate should be around 1-in-10,000 so generating 100,000 packets means that there is a 99.995% chance that a link carrying the flow will generate at least 1 sample (the probability is easily calculated using the Binomal distribution, see Wolfram Alpha).

The trace.py script will start printing links traversed by the flow immediately they are detected (typically in less than a second after starting the test):
./trace.py 'ipsource=172.16.134.1&udpsourceport=1111&ipdestination=172.16.135.1&udpdestinationport=53'
leaf1-spine2
leaf2-spine2
The above example traced the single path traversed by a specific connection. To explore all paths, drop the source port and hping3 will cycle through source ports and the traffic should be visible on all the equal cost paths (provided that a layer 4 hash function has been selected by the switches).

Drop the source port from the trace.py filter:
./trace.py 'ipsource=172.16.134.1&ipdestination=172.16.135.1&udpdestinationport=53'
Drop the -k and -s options from the hping3 command:
sudo hping3  -c 100000 -i u100 --udp -p 53 172.16.138.1
The open source trace-flow application is a graphical version of the trace.py script written using sFlow-RT's JavaScript API (see Writing Applications). The screen capture above displayed the path for the test traffic within a second of the start of test.

Continuous network-wide monitoring of leaf and spine networks using sFlow leverages the capabilities of commodity switch hardware and provides centralized visibility that simplifies network operation and trouble shooting.

Real-time traffic visualization using Netflix Vizceral

The open source sflow-rt/vizceral project demonstrates how real-time sFlow network telemetry can be presented using Netflix Vizceral. The central dot represents the Internet (all non-local addresses). The surrounding dots represents addresses grouped into sites, data centers, buildings etc. The animated particle flows represent packet flows with colors indicating packet type: TCP/UDP shown in blue, ICMP shown in yellow, and all other traffic in red.
Click on a node to zoom in to show packets flowing up and down the protocol stack. Press the ESC key to unzoom.

The simplest way to run the software is to use the pre-built Docker image:
docker run -p 6343:6343/udp -p 8008:8008 sflow/vizceral
The Docker image also contains demo data based on Netflix's public cloud infrastructure:
docker run -e "RTPROP=-Dviz.demo=yes" -p 8008:8008 sflow/vizceral
In this case, the detailed view shows messages flowing between microservices running in the Amazon public cloud. Similar visibility could be obtained by deploying Host sFlow agents with associated modules for web and application servers and modifying sflow/vizceral to present the application transaction flows. In private data centers, sFlow support in load balancers  (F5, A10) provides visibility into interactions between application tiers. See Microservices for more information on using sFlow to instrument microservice architectures.
Collecting Docker Swarm service metrics describes how meta data about services running on Docker Swarm can be combined with sFlow telemetry to generate service level metrics. A similar approach could be taken to display Docker Swarm service interactions using Vizceral. Using network visibility to measure flows between services greatly simplifies the monitoring task, avoiding the challenge of adding instrumentation to each container.

Flow Trend

The open source sflow-rt/flow-trend project displays a real-time trend chart of network traffic that updates every second. Defining Flows describes how to break out traffic by different traffic attributes, including: addresses, ports, VLANs, protocols, countries, DNS names, etc.
docker run -p 6343:6343/udp -p 8008:8008 sflow/flow-trend
The simplest way to run the software is using the docker. Configure network devices to send standard sFlow telemetry to Flow Trend. Access the web user interface on port 8008.

Real-time visibility and control of campus networks

Many of the examples on this blog describe network visibility driven control of data center networks. However, campus networks face many similar challenges and the availability of industry standard sFlow telemetry and RESTful control APIs in campus switches make it possible to apply feedback control.

HPE Aruba has an extensive selection of campus switches that combine programmatic control via a REST API with hardware sFlow support:
  • Aruba 2530 
  • Aruba 2540 
  • Aruba 2620
  • Aruba 2930F
  • Aruba 2930M
  • Aruba 3810
  • Aruba 5400R
  • Aruba 8400
 This article presents an example of implementing quota controls using HPE Aruba switches.
Typically, a small number of hosts are responsible for the majority of traffic on the network: identifying those hosts, and applying controls to their traffic to prevent them from unfairly dominating, ensures fair access to all users.

Peer-to-peer protocols (P2P) pose some unique challenges:
  • P2P protocols make use of very large numbers of connections in order to quickly transfer data. The large number of connections allows a P2P user to obtain a disproportionate amount of network bandwidth; even a small number of P2P users (less than 0.5% of users) can consume over 90% of the network bandwidth.
  • P2P protocols (and users) are very good at getting through access control lists (acl) by using non-standard ports, using port 80 (web) etc. Trying to maintain an effective filter to identify P2P traffic is a challenge and the resulting complex rule sets consume significant resources in devices attempting to perform classification.
In this example, all switches are configured to stream sFlow telemetry to an instance of the sFlow-RT real-time sFlow analyzer running a quota controller. When a host exceeds its traffic quota, a REST API call is made to the host's access switch, instructing the switch to mark the host's traffic as low priority. Marking the traffic ensures that if congestion occurs elsewhere in the network, typically on the Internet access links, priority queuing will cause marked packets can be dropped, reducing the bandwidth consumed by the marked host. The quota controller continues to monitor the host and the marking action is removed when the host's traffic returns to acceptable levels.

A usage quota is simply a limit on the amount of traffic that a user is allowed to generate in a given amount of time. Usage quotas have a number of attributed that make them an effective means of managing P2P activity:
  • A simple usage quota is easy to maintain and enforce and encourages users to be more responsible in their use of shared resources.
  • Since quota based controls are interested in the overall amount of traffic that a host generates and not the specific type of traffic, they don't encourage users to tailor P2P application setting to bypass access control rules and so their traffic is easier to monitor.
  • A quota system can be implemented using standard network hardware, without the addition of a "traffic shaping" appliance that can become a bottleneck and point of failure.
The following quota.js script implements the quota controller functionality:
var user = 'manager';
var password = 'manager';
var scheme = 'http://';
var mbps = 10;
var interval = 10;
var timeout = 20;
var dscp = '10';
var groups = {'ext':['0.0.0.0/0'],'inc':['10.0.0.0/8'],'exc':['10.1.0.0/16']};

function runCmd(agent,cmd) {
var headers = {'Content-Type':'application/json','Accept':'application/json'};
// create session
var auth = http2({
url:scheme+agent+'/rest/v3/login-sessions',
operation:'post',
headers:headers,
body: JSON.stringify({userName:user, password:password})
});
headers['Cookie']=JSON.parse(auth.body).cookie;

// make request
var resp = http2({
url:scheme+agent+'/rest/v3/cli',
operation:'post',
headers:headers,
body: JSON.stringify({cmd:cmd})
});
var result = base64Decode(JSON.parse(resp.body).result_base64_encoded);

// end session
var end = http2({
url:scheme+agent+'/rest/v3/login-sessions',
operation:'delete',
headers:headers
});
return result;
}

setGroups('site',groups);

setFlow('src', {
keys:'ipsource',
value:'bytes',
filter:'direction=ingress&group:ipsource:site=inc&group:ipdestination:site=ext',
t:interval
});

setThreshold('quota', {
metric:'src',
value:mbps*1000000/8,
byFlow: true,
timeout:timeout,
filter:{ifspeed:[10000000,100000000,1000000000]}
});

var controls = {};
setEventHandler(function(evt) {
var ip = evt.flowKey;
if(controls[ip]) return;

var agent = evt.agent;
var ds = evt.dataSource;
controls[ip] = {agent:agent,ds:ds,time:Date.now()};
logInfo('mark '+ip+' agent '+agent);
try { runCmd(agent,'qos device-priority '+ip+' dscp '+dscp); }
catch(e) { logWarning('runCmd error ' + e); }
}, ['quota']);

setIntervalHandler(function() {
for(var ip in controls) {
var ctl = controls[ip];
if(thresholdTriggered('quota',ctl.agent,ctl.ds+'.src',ip)) continue;

logInfo('unmark '+ip+' agent '+ctl.agent);
try { runCmd(ctl.agent,'no qos device-priority '+ip); }
catch(e) { logWarning('runCmd error ' + e); }
delete controls[ip];
}
});
Some notes on the script:
  • Writing Applications provides an overview of the sFlow-RT scripting API.
  • HPE ArubaOS-Switch REST API and JSON Schema Reference Guide 16.03 describes the REST API calls in the runCmds() function.
  • The groups variable defines groups of IP addresses, identifying external addresses (ext), addresses included as candidates for the quota controller (inc), and addresses excluded from quota controls (exc).
  • Defining Flows describes the arguments to the setFlow() function. In this case, calculating a 10 second moving average of traffic from local sources (inc) to external destinations (ext).
  • The setThreshold() function creates a threshold that triggers if the moving average of traffic from an address exceeds 10Mbit/s. The thresholds are only applied to 10M, 100M and 1G access ports, ensuring that controls are only applied to access layer switches and not to 10G ports on aggregation and core switches.
  • The setEventHandler() function processes the events, keeping track of existing controls and implementing new DSCP marking rules.
  • The setIntervalHandler() function runs periodically and removes marking rules when they are not longer required (after the threshold timeout has expired).
  • The ArubaOS commands to add / remove DSCP marking for the host are highlighted in blue.
The easiest way to try out the script is to use Docker to run sFlow-RT:
docker run -v $PWD/cli.js:/sflow-rt/quota.js -e "RTPROP=-Dscript.file=quota.js" -p 6343:6343/udp -p 8008:8008 sflow/sflow-rt
2017-09-27T02:32:14+0000 INFO: Listening, sFlow port 6343
2017-09-27T02:32:14+0000 INFO: Listening, HTTP port 8008
2017-09-27T02:32:14+0000 INFO: quota.js started
2017-09-27T02:33:53+0000 INFO: mark 10.0.0.70 agent 10.0.0.232
2017-09-27T02:34:25+0000 INFO: unmark 10.0.0.70 agent 10.0.0.232
The output indicates that a control marking traffic from 10.0.0.70 was added to edge switch 10.0.0.232 and removed just over 30 seconds later.
The screen capture using Flow Trend to monitor the core switches shows the controller in action. The marking rule is added as soon as traffic from 10.0.0.70 exceeds the 10Mbps quota for 10 seconds (the DSCP marking shown in the chart changes from redbe(0) to blueaf11(10)). The marking rule is removed once the traffic returns to normal.
The quota settings in the demonstration were aggressive. In practice the threshold settings would be higher and the timeouts longer in order to minimize control churn. The trend above was collected from a university network of approximately 20,000 users that implemented a similar control scheme. In this case, the quota controller was able to consistently mark 50% of the traffic as low priority. Between 10 and 20 controls were in place at any given time and the controller made around 10 control changes an hour (adding or removing a control). During busy periods, congestion on the campus Internet access links was eliminated since marked traffic could be discarded when necessary.

Implementing usage quotas is just one example of applying measurement based control to a campus network. Other interesting applications include:
Real-time measurement and programmatic APIs are becoming standard features of campus switches, allowing visibility driven automatic control to adapt the network to changing network demands and security threats.
Viewing all 350 articles
Browse latest View live