This article describes how build an inexpensive Raspberry Pi 5 based server for real-time flow analytics using industry standard
sFlow streaming telemetry. Support for sFlow is widely implemented in datacenter equipment from vendors including: A10, Arista, Aruba, Cisco, Edge-Core, Extreme, Huawei, Juniper, NEC, Netgear, Nokia, NVIDIA, Quanta, and ZTE.
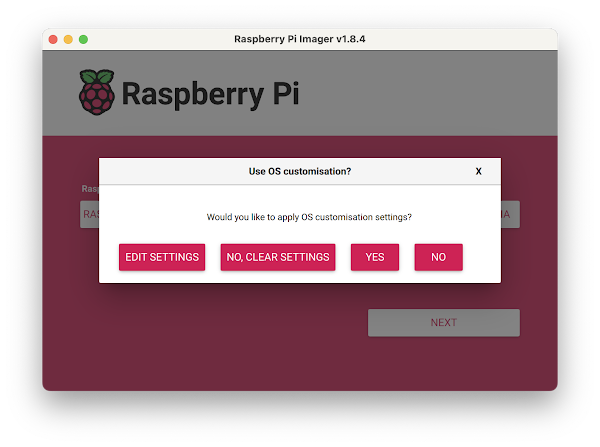
In this example, we will use an 8G Raspberry Pi 5 running Raspberry Pi OS Lite (64-bit). The easiest way to format a memory card and install the operating system is to use the
Raspberry Pi Imager (shown above).
Click on
EDIT SETTINGS button to customize the installation.
Set a
hostname,
username, and
password.
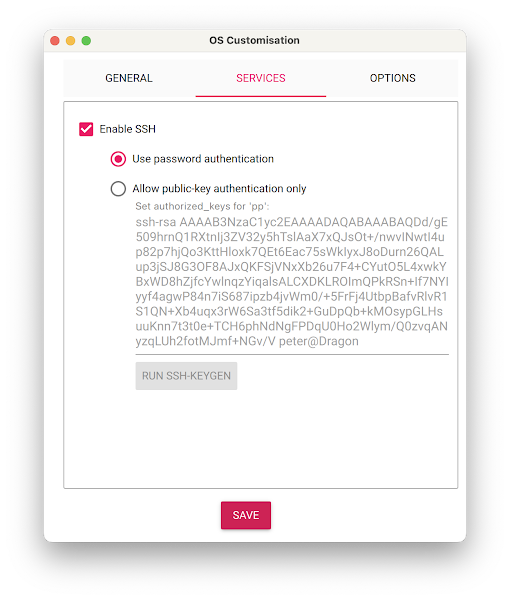
Click on the
SERVICES tab and select
Enable SSH. Click
SAVE to save the settings and then
YES to apply the settings and create a bootable micro SD card. These initial settings allow the Rasberry Pi to be accessed over the network without having to attach a screen, keyboard, and mouse.
ssh pp@192.168.4.170
Use ssh to log into Raspberry Pi (having installled the micro SD card).
sudo apt-get update && sudo apt-get -y upgrade
Update packages and OS to latest version.
curl -sSL https://get.docker.com | sudo sh
Install Docker.
sudo usermod -aG docker $USER
Give permission to run Docker without sudo command. Exit ssh session and log in again to pick up the new settings.
docker run hello-world
Run the
hello-world container to verify that docker in properly installed and running.
git clone https://github.com/sflow-rt/prometheus-grafana.git
cd prometheus-grafana
./start.sh
Start
sFlow-RT,
Prometheus, and
Grafana using Docker compose.
Configure
sFlow Agents embedded in switches, routers and servers to stream sFlow telemetry to the Raspberry Pi. The sFlow-RT
Getting Started guide shows how to verify that sFlow is being received and includes tools flow and counter based analytics.
For example, the
Flow Browser application lets you list attributes of network traffic that you are interested in and trend top flows with the attributes in real-time (up to the second).
Defining Flows describes the flow analytics capability of sFlow-RT that can be explored.
Deploy real-time network dashboards using Docker compose describes how to configure Prometheus and Grafana to capture time series data and create custom dashboards.
The Raspberry Pi 5 is surprisingly capable, this pocket-sized server can easily monitor thousands of high speed (100G+) links, providing up to the second visibility into network flows. In this example, sFlow telemetry from 100 switches, each with 48 active 100G ports, was easily handled by the Raspberry Pi 5. Performance of the Prometheus database is likely to be the limiting factor given the relatively slow disk performance of the micro SD card, but could be improved adding an M.2 PCIe disk.