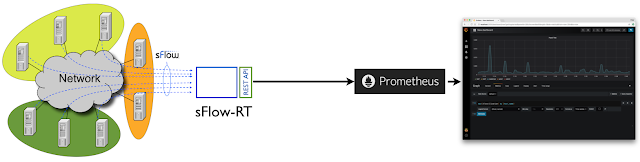
The diagram above shows the elements of the solution: sFlow telemetry streams from hosts and switches to an instance of sFlow-RT. The sFlow-RT analytics software converts the raw measurements into metrics that are accessible through a REST API. The sflow-rt/prometheus application extends the REST API to include native Prometheus exporter functionality allowing Prometheus to retrieve metrics. Prometheus stores metrics in a time series database that can be queries by Grafana to build dashboards.
The Docker sflow/prometheus image provides a simple way to run the application:
docker run --name sflow-rt -p 8008:8008 -p 6343:6343/udp -d sflow/prometheusConfigure sFlow agents to send data to the collector, 10.0.0.70, on port 6343.
Verify that the metrics are available using cURL:
$ curl http://10.0.0.70:8008/app/prometheus/scripts/export.js/dump/ALL/ALL/txtIf the sFlow agents don't provide host and ifname information, enable SNMP to retrieve sysName and ifName data to populate these fields:
ifinucastpkts{agent="10.0.0.30",datasource="2",host="server",ifname="enp3s0"} 9.44
ifoutdiscards{agent="10.0.0.30",datasource="2",host="server",ifname="enp3s0"} 0
ifoutbroadcastpkts{agent="10.0.0.30",datasource="2",host="server",ifname="enp3s0"} 0
ifinerrors{agent="10.0.0.30",datasource="2",host="server",ifname="enp3s0"} 0
docker run --name sflow-rt -p 8008:8008 -p 6343:6343/udp -d sflow/prometheus \By default SNMP version 2c will be used with the public community string. Additional System Properties can be used to override these defaults.
-Dsnmp.ifname=yes

global:Now start Prometheus:
scrape_interval: 15s
evaluation_interval: 15s
rule_files:
# - "first.rules"
# - "second.rules"
scrape_configs:
- job_name: 'sflow-rt'
metrics_path: /app/prometheus/scripts/export.js/dump/ALL/ALL/txt
static_configs:
- targets: ['10.0.0.70:8008']
docker run --name prometheus --rm -v $PWD/data:/prometheus \The screen capture above shows the Prometheus web interface (accessed on port 9090).
-v $PWD/prometheus.yml:/etc/prometheus/prometheus.yml \
-p 9090:9090 -d prom/prometheus

The following command shows how to run Grafana under Docker:
docker run --name grafana -v $PWD/data:/var/lib/grafana \Access the Grafana web interface on port 3000, configure a data source for the Prometheus database, and start building dashboards. The screen capture above shows the same chart built earlier using the native Prometheus interface.
-p 3000:3000 -d grafana/grafana