 |
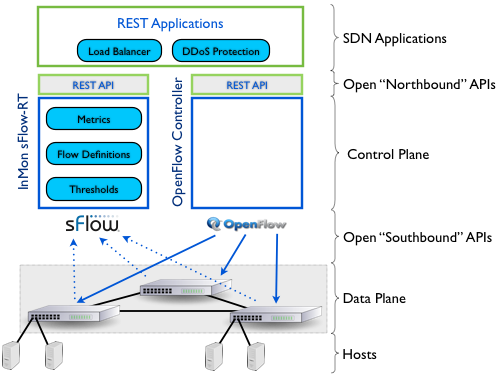
| Figure 1: Performance aware SDN applications with sFlow-RT |
Figure 1 shows how sFlow-RT fits into an SDN stack. The sFlow-RT module receives a continuous stream of sFlow datagrams from network devices and converts them into actionable metrics, accessible through a REST (Representational State Transfer) API. REST Applications make use of the API to detect changing network traffic and adapt the network by pushing controls to an OpenFlow controller (for example, the open source Floodlight OpenFlow Controller). The controller uses the OpenFlow protocol to communicate with the network devices and reconfigure their forwarding behavior.
Note: While this example focuses on network visibility, sFlow integrates network, server and application monitoring and sFlow-RT delivers real-time visibility into these metrics, allowing the SDN controller to be server and application aware.
 |
| Figure 2: Denial of service protection example |
1. define address groups
Address groups (defined using CIDR notation) are a useful way of categorizing traffic. In this case, allowing internal and external addresses to be identified:
curl -H "Content-Type:application/json" -X PUT --data "{external:['0.0.0.0/0'], internal:['10.0.0.0/8']}" http://localhost:8008/group/json2. define flowsFlows are defined by naming the packet attributes used to group packets into flows (keys), a value to associate with the flow, and a filter to select specific traffic. In this case we are interested in defining incoming flows, i.e. from external source addresses to internal destination addresses:
curl -H "Content-Type:application/json" -X PUT --data "{keys:'ipsource,ipdestination', value:'frames', filter:'sourcegroup=external&destinationgroup=internal'}" http://localhost:8008/flow/incoming/json3. define thresholdsThe following command defines a threshold of 1000 packets per second on any incoming flow:
curl -H "Content-Type:application/json" -X PUT --data "{metric:'incoming', value:1000}" http://localhost:8008/threshold/incoming/json4. receive threshold eventThe application polls for events, using "long polling" to receive asynchronous notification of new events. The following command asks for any events after eventID=4, the most recent event received, waiting up to 60 seconds for a result:
curl "http://localhost:8008/events/json?eventID=4&timeout=60"The following event shows that an incoming flow generating 1,531 packets per second has exceeded the threshold:
[{
 "agent": "10.0.0.16",
 "dataSource": "4",
 "eventID": 5,
 "metric": "incoming",
 "threshold": 1000,
 "thresholdID": "incoming",
 "timestamp": 1357169369479,
 "value": 1531.149418835524
}]
5. monitor flowAdditional information about the flow is retrieved using the information from the event, including: agent, datasource and metric:
curl http://localhost:8008/metric/10.0.0.16/4.incoming/jsonThe following result shows that the value is still increasing and identifies the specific flow that exceeded the threshold, a flow from external address 192.168.1.1 to internal address 10.0.0.151:
[{
 "agent": "10.0.0.16",
 "dataSource": "4",
 "metricName": "incoming",
 "metricValue": 1582.93965044338071,
 "topKeys": [
  {
   "key": "192.168.1.1,10.0.0.151",
   "updateTime": 1357169662500,
   "value": 1582.93965044338071
  },
  {
   "key": "192.168.1.4,10.0.0.151",
   "updateTime": 1357169665500,
   "value": 46.552918457198984
  }
 ],
 "updateTime": 1357169665500
}]
6. deploy controlThe OpenFlow controller is instructed to drop traffic from the external attacker (192.168.1.1)
7. monitor flow
Continue to monitor the flow to verify that the control has taken effect.
8. release control
At some later time the control is removed in order to release flow table entries tied up in blocking the attack. If the attacker returns, a new event will be generated, triggering a new control.
The following Python script, ddos.py, combines the steps to demonstrate a simple application:
import requests
import json

groups = {'external':['0.0.0.0/0'],'internal':['10.0.0.0/8']}
flows = {'keys':'ipsource,ipdestination','value':'frames','filter':'sourcegroup=
external&destinationgroup=internal'}
threshold = {'metric':'incoming','value':1000}
target = 'http://localhost:8008'Running the script generates the following output within seconds of a large flow starting:
r = requests.put(target + '/group/json',data=json.dumps(groups))
r = requests.put(target + '/flow/incoming/json',data=json.dumps(flow
s))
r = requests.put(target + '/threshold/incoming/json',data=json.dumps
(threshold))
eventurl = target + '/events/json?maxEvents=10&timeout=60'
eventID = -1
while 1 == 1:
r = requests.get(eventurl + '&eventID=' + str(eventID))
if r.status_code != 200: break
events = r.json()
if len(events) == 0: continue
eventID = events[0]["eventID"]
for e in events:
if 'incoming' == e['metric']:
r = requests.get(target + '/metric/' + e['agent'] + '/' + e['dataSource'] + '.' + e['metric'] + '/json')
metric = r.json()
if len(metric) > 0:
print metric[0]["topKeys"][0]["key"]
$ python ddos.pysFlow-RT is free for non-commercial use. Please try out the software. Comments, questions and general discussion of performance aware SDN are welcome on the sFlow-RT group.
192.168.1.1,10.0.0.151