 |
| Credit: Accelerating Open vSwitch to “Ludicrous Speed” |
The recent Open vSwitch 2014 Fall Conference included the talk, Managing Open vSwitch across a large heterogeneous fleet by Chad Norgan, describing Rackspace's experience with running a large scale OpenStack deployment using Open vSwitch for network virtualization. The talk describes the key metrics that Rackspace collects to monitor the performance of the large pools of Open vSwitch instances.
This article discusses the metrics presented in the Rackspace talk and describes how the embedded sFlow agent in Open vSwitch was extended to efficiently export the metrics.

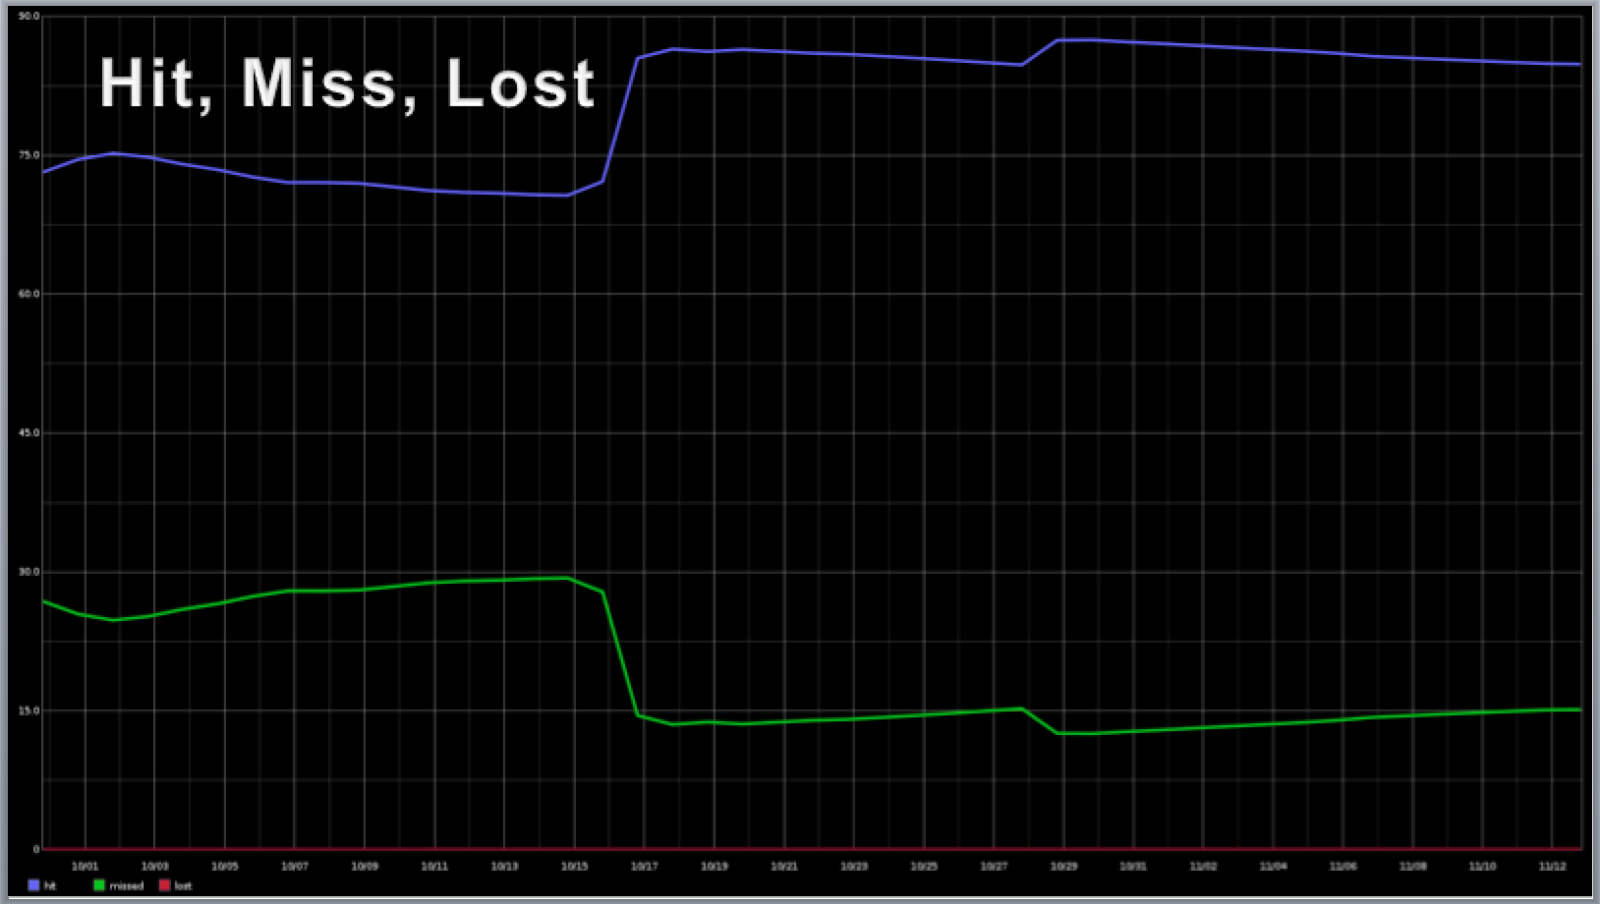

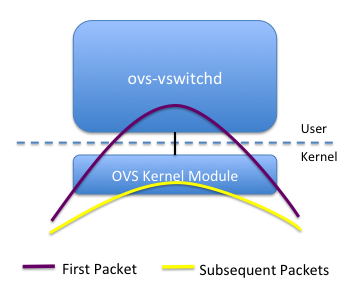
Currently, monitoring Open vSwitch cache performance involves polling each switch using the ovs-dpctl command and collecting the results. Polling is complex to configure and maintain and operational complexity is reduced if the Open vSwitch is able to push the metrics - see Push vs Pull
The following sFlow structure was defined to allow Open vSwitch to export cache statistics along with the other sFlow metrics that are pushed by the sFlow agent:
/* Open vSwitch data path statistics */The sFlow agent was also extended to export CPU and memory statistics for the ovs-vswitchd process by populating the app_resources structure - see sFlow Application Structures.
/* see datapath/datapath.h */
/* opaque = counter_data; enterprise = 0; format = 2207 */
struct ovs_dp_stats {
unsigned int hits;
unsigned int misses;
unsigned int lost;
unsigned int mask_hits;
unsigned int flows;
unsigned int masks;
}
These extensions are the latest in a set of recent enhancements to the Open vSwitch sFlow implementation, including:
The Open vSwitch project first added sFlow support five years ago and these recent enhancements build on the detailed visibility into network traffic provided by the core Open vSwitch sFlow implementation and the complementary visibility into hosts, hypervisors, virtual machines and containers provided by the Host sFlow project.
Broad support for the sFlow standard across the cloud data center stack provides simple, efficient, low cost, scaleable, and comprehensive visibility. The standard metrics can be consumed by a broad range of open source and commercial tools, including: sflowtool, sFlow-Trend, sFlow-RT, Ganglia, Graphite, InfluxDB and Grafana.
 |
| Visibility and the software defined data center |